|
|
Proximity/LUCA Main Page |
CommunityViewer & LUCA -- Regional Project Files This document provides information on CommunityViewer (CV) project filesets developed for each of the Georgia sixteen regional development centers. Project file names are listed below.
Using separately provided instructions, the project fileset should be downloaded and expanded to the folder c:\cv\gafiles. After expanding the fileset, start CommunityViewer and use File>Open to open the project file name listed above. For example, to open the Atlanta Regional Commission project file, you would open the file c:\cv\gafiles\arrdc.gpr. The CV start-up view shows the region by county. All projects include the same files but differ by the geographic scope of some layers/shapefiles. The layers listed at the top of the legend panel (blocks, tracts, roads) contain geography and subject matter only for the specific region. All other layers (except U.S. by state) include the same shapefiles. Project layers, as presented in the legend panel, are summarized below. RDC TGR Blocks • This layer illustrates use a wider boundary/outline and transparency setting so that the blocks may be more easily viewed in context of other geography. • This layer includes the Census 2000 population and housing count data items/fields. • These boundaries are based on the TIGER/Line 2006 Second Edition files. RDC Tracts %Poverty • This layer illustrates use of the layer editor to compute percent population in poverty. • These boundaries are based on the TIGER/Line 2006 Second Edition files. RDC TGR Roads • These roads/streets are based on the TIGER/Line 2006 Second Edition files. States • This layer establishes the GIS project maximum extent and frames Georgia in the context of the U.S. GA RDCs • Georgia Regional Development Center regions developed from state by county boundary file. $MHI by BG • This layer illustrates use of a thematic map to visually assess economic prosperity (median household income, $MHI) by the smallest geographic area for which Census 2000 sample-based data were tabulated. • This layer includes the Census 2000 demographic profile 3 subject matter items. • These boundaries are based on the TIGER/Line 2006 Second Edition files. Places • This layer enables viewing of cities/places in the context of other geography. • See these notes about using the Boundary and Annexation Survey codes. • These boundaries are based on the TIGER/Line 2006 Second Edition files. Counties • This layer illustrates use of the layer editor to assign colors to counties based on MTAIP status. • This layer includes the Census intercensal population estimates and components of population change subject matter items. Cty Pop %Chg 00-06 • This layer illustrates use of a thematic map to visually assess county demographic change. • This layer uses the same county shapefile as the above listed county layer and illustrates how the same shapefile may be used multiple times in a project to convey different attributes. The shapefiles and fields included with each layer are listed in the Excel file: http://proximityone.com/luca/mgrdc_metadata.xls. By convention, the layers are listed in inverted order. As an example, the U.S. by state layer, shown first in the Excel file, appears as the last layer in the legend panel. Relating this Project Structure to Census 2010 LUCA. These GIS projects provide a standardized GIS structure for each region that make use of many of the same key layers as required for Census 2010 LUCA (blocks, tracts, places, counties, roads). As TIGER/Line shapefiles become available, those shapefiles can be used to replace those based on TIGER/Line 2006 Second Edition. The project structure offers a way to integrate the results of Census 2010 LUCA developments (including local-sourced address list data and updated TIGER/Line consistent streets shapefiles) into tools that can be used for other wide-ranging planning and analysis applications. The following view illustrates use of the Southwest RDC project augmented with local-sourced LUCA-related data. The Thomas County streets and E911 shapefiles have been added to the project. This zoom-in view of Thomasville city shows the census block boundaries (opaque gray) with census block geocodes (boundaries and labels from the census block layer). 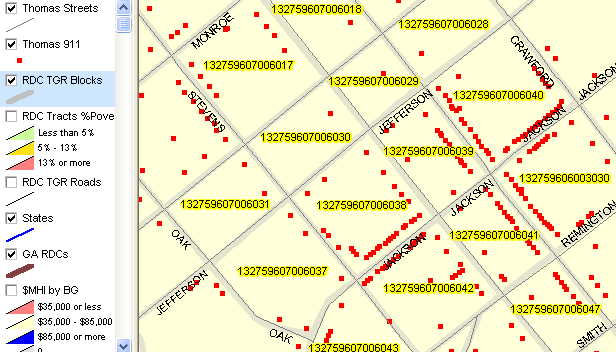
The step-by-step process for using CommunityViewer to parse a local-sourced address file into the Census/LUCA format is reviewed at http://proximityone.com/cv_luca_localaddressfile.htm. Operational use of the data and projects are reviewed in Census 2010 Web Meetings. Additional Usage Notes. The places layer shapefile dbf contains Boundary and Annexation Survey (BAS) information. The ga_plc.dbf table for the shapefile ga_plc.shp contains a field named 'ANNEX2007' where a "Y" value indicates the city has annexed during calendar year 2007, and which, except for LUCA, would otherwise be reported to the Census Bureau during BAS 2008; these annexations should be reported now during LUCA. Also in the Place map, the field named 'NONRESPONSE' having a value of "Y" indicates the city annexed during calendar year 2006 but failed to report the annexations during BAS 2007. These annexations, and any other known older boundary changes, should be reported now during LUCA. Example of how to use these codes. To view places that annexed during calendar year 2007, follow these steps. • With the RDC project open, click the Places layer to make it active. • Dbl-click the places layer name to start the CV Layer Editor. • Click Section tab on Layer Editor form. • Key in this expression in the Render edit box: annex2007 like 'Y%' • Click OK and close Layer Editor. • Click Places layer checkbox in legend panel. • Places meeting this criteria now appear in yellow. Closing the project at this time, without a File>Save Project, will lose these new settings (suggested). See the User Guide for additional information. Terms of Use. The data and structures used in these project filesets are licensed for use by the State of Georgia Department of Community Affairs, Georgia regional development centers, and local government agencies to facilitate development and use of Census 2010 and related geodemographics. These data and files are not intended for direct or indirect redistribution to any other person or entity without authorization by Proximity. |
|
|