|
|
SDA Main Page |
School Demographic Analysis CommunityViewer (CV) is used to display a map of school districts located in the Houston, Texas metro area (Houston MSA shown with blue boundary). This view shows a thematic map of the percent change in enrollment by school district between the 1999-2000 and 2004-2005 school years. By viewing these patterns, it is easy to determine the direction and magnitude of enrollment change for the region overall as well as specific districts. Operations reviewed here can be performed with any set of schools or school districts in the U.S. 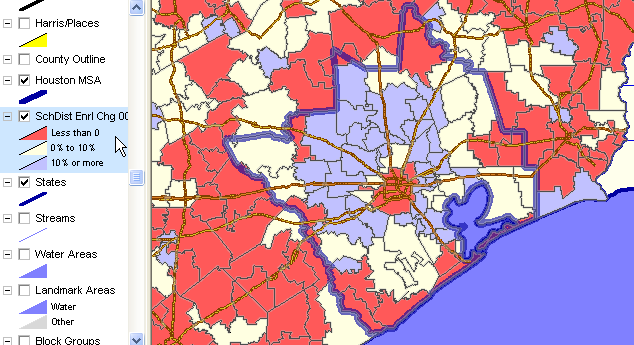
Using the CV identify tool, the attributes of any selected school district may be viewed in a mini-profile. The next graphic shows a profile for Alief ISD (by pointer in map). The enrollment is shown by year in the profile -- the same data used to display the above thematic map. 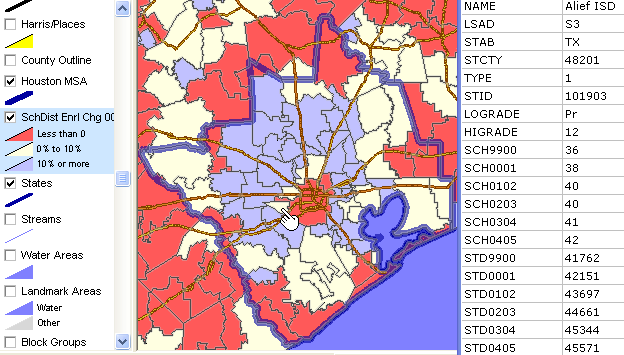
Using the zoom tool, the next graphic shows a zoom-in view with district names as labels and showing the schools layer. 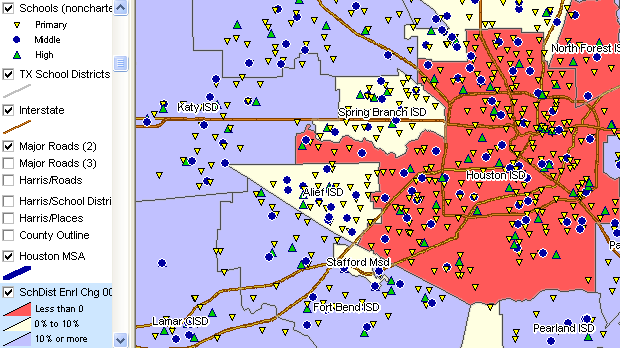
To view more about these schools, the SDA feature is used. |
|
|