|
|
|
Comparative Analysis Demographic Profiles
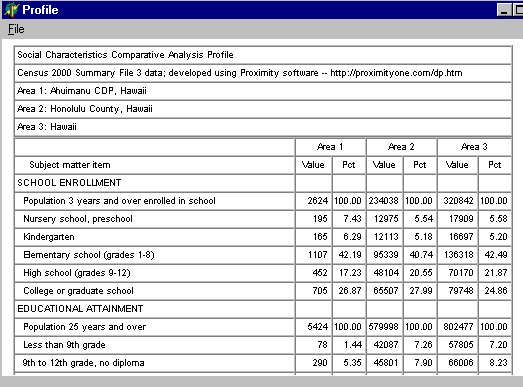
What is a comparative analysis profile and why is it needed? A comparative analysis profile provides a tabular data view of the same demographic/economic attributes of any three user selected geographic areas in adjacent columns for easy comparative viewing. The following graphic shows an example of a portion of a social characteristics comparative analysis profile prepared using the Proximity Profile software. 
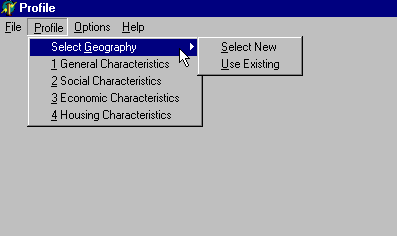
A closer look. The partial profile presented above compares attributes for the place of Ahuimanu CDP (census designated place) to the county in which it is located (Honolulu County) to the state in which it is located (Hawaii). The power of the Profile software is that this place could have been compared to any other geographic area. Without special programming, this type of comparative analysis cannot be prepared using any other program. By examining the tables presented in the Social Characteristics profile, it can be seen that residents of Ahuimanu have a higher level of educational attainment than residents of Honolulu County and Hawaii overall. Similarly, residents of this area move less frequently than do residents of the County and State overall. Proportionately more of the Ahuimanu residents speak English only as compared to the County and State. From the Economic Characteristics profile, it can be observed that a larger percentage of the population is in the labor force with a much higher proportion of those employed in managerial and professional occupations as compared to the County and State. The median household income in Ahuimanu is roughly 40-percent higher than the State median. From the Housing Characteristics profile, it can be observed that the value of owner-occupied units is $270,200, a little below the County median value of $309,000. Review these details yourself, in more depth, by examining the profiles described below. Most widely used SF3 data. The Profile version 1 software enables the user to generate four types of comparative analysis profiles. Samples of these profiles for Ahuimanu, HI, referenced above, may be viewed using the following links. Full sets of integrated sample profiles are available for selected areas listed in the leftmost column. • DP1 General Demographics • DP2 Social Characteristics • DP3 Economic Characteristics • DP4 Housing Characteristics Each of the above links enables you to view the actual output generated by the Profile software. The default output structure is an HTML file enabling a user to immediately post these data to share with a wider range of users interested in the analysis. The content and organization of the data is patterned after the Census Bureau's demographic profiles initially released on a flow basis starting in May 2002. See http://proximityone.com/cen2000.htm#cen2000dp for more information. Easy to Use. The Profile software provide an easy-to-use user interface with almost no learning time required. The graphic presented below shows the simplicity of operation. 
The Profile software user is led through a step-by-step set of screens and prompts to select geographic areas for analysis. Geography selected may be saved to a file for subsequent use. Geography Selection. You may create the geographic selection file with your own editor software. Or, if you are less familiar with the codes and tools, use the screen prompting process as summarized here. With a plan in mind to select a city, then corresponding county, then corresponding state (as used in sample profiles), we start Geography > Select New and panel 1 appears:
Increasing the Power. At this time, the Profile software enables the user to generate the four types of profiles for any combination of places, counties, and states. Soon, the scope of this capability will be expanded to include all types of geography available in Summary File 3 (e.g., census tracts, block groups, ZIP code areas, etc.). In addition, the software will enable the aggregation of data for geographic area grouping such as a set of 5 ZIP code areas. How do I get the data? There are two ways to acquire the data for use with the Profile software. Option 1 -- the core data used by the Profile software are freely available in ASCII form and downloadable via Web server. The data may be converted into a database structure using the Proximity ASC2DBF software. Option 2 -- you can acquire the state or national scope ready-to-use database from Proximity. The Proximity Demographic Profile Database (DPD) is available as DPD1 and DPD2. Both databases contain all of the subject matter items, as shown in the sample profiles, but include different levels of geography. The Demographic Profile Database 1 (DPD1) includes data for cities/places, counties, county subdivisions (CCD), metropolitan areas, states, and U.S. summary. DPD1 is now available for the U.S. and includes data for approximately 47,000 geographic areas. The Demographic Profile Database 2 (DPD2) includes data for the same geographic areas as DPD1 plus census tracts, ZIP code tabulation areas, block groups, and optionally custom tabulation areas. DPD2 will become available starting in late June 2002 on a state-by-state flow basis with completion (all states) scheduled for September 2002. 1990-2000 Trend Profile. How much has your community/market changed in the past 10 years? • How does a primary area of interest compare to adjacent/peer areas? • What are the implications for future change? • What are the metrics that should be used for assessments? Answers to these questions are provided in large measure by the Proximity 1990-2000 Census demographic trend profile. Read on to learn about how you can acquire a complimentary profile for your community, county, or state. Most of this section and examples show the use of the Profile software to prepare Census 2000 demographic profiles. An augmented version of the Profile software (not available in the demo) also generates 1990-2000 Census demographic trend profiles. A sample of the demographic trend profile for Wichita, KS may downloaded/viewed as an XLS file (if you receive a userid request, press cancel and the spreadsheet will open, provided you have Excel on you computer). The trend report is generated by the Profile software as an Excel spreadsheet file. The augmented Profile software can display more than 40 geographic areas in a single spreadsheet file. The sample includes two areas: Wichita city and the State of Kansas. For each geographic area in the report, 6 columns of data are presented for approximately 500 subject matter items (derived from 1990 Census STF1 and STF3 and Census 2000 SF1 and SF3). These 6 columns include: 1990 Census data values 1990 Census percent distributions Census 2000 data values Census 2000 percent distributions 1990-2000 Census change data values 1990-2000 Census percent change For a limited time, you may order a complimentary demographic trend profile for any one place (incorporated city of Census Designated Place), county, or state. Complete the order form to request your complimentary profile. There is no fee and any one person or organizational unit may only order one complimentary profile. Download Profile Version 1.1. To examine features of the Profile software and database, register, download the Profile 1.1 system, and then review the operations on your own computer. In the registration form, provide your contact information and check the checkbox for Profile 1.1. Downloading information is provided following registration. Profile Version 1.1 is a production version of the software and database. The software is structured to operate only with the State of Hawaii. The database provided with Profile 1.1 is the complete DPD1 database for the State of Hawaii. Profile Version 1.1 may be used to support any application that does involve generation of income, is not supported as funded research, and does not result in profit. Ordering Profile Software and Databases. The Profile software and database may be ordered via the order Webform if paying by check or the secure cyberstore if paying by credit card. These resources are packaged as follows:
More Options. Looking for more data viewing and analytical options? The features of Profile are contained within the Proximity Interactive Analysis System. IAS provides many more technically oriented features enabling a wide range of analysis with Census and non-Census data. |
|