|
|
|
School District Demographic Profile Analyst -- assessing school & school district potential and effectiveness
Measures of school performance are important and should be examined in an absolute manner. But, in examining ways to improve school performance, it is essential to understand the characteristics of the "school district community." For example, school districts with a relatively high level of the population having limited English proficiency will require more and different resources to meet desired levels of school/education outcomes relative to school district communities with higher levels of English language proficiency. Funds from the U.S. Department of Education "Title I" program, the largest Federal government K-12 education funding program, are spent annually to improve educational opportunities for children in schools and school districts where there is a high incidence of economically disadvantaged students. As important as this is, there are many other factors that diminish K-12 educational performance and individual education opportunities. This Web page is focused on resources and methodologies that can be used to assess the "relative challenge" faced by individual school systems. The DPA resource includes two primary components: comparative analysis profiles and socioeconomic status analysis. Both features are accessed via the DPA main screen display shown below. Comparative Analysis Demographic Profile 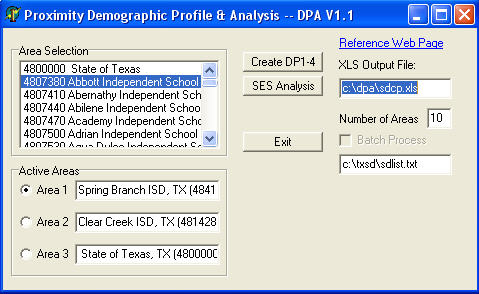
Comparative Analysis Screen Display Results With the active areas set as shown above, clicking the Create DP1-4 button generates a grid display on the screen. A portion of the display is shown below. 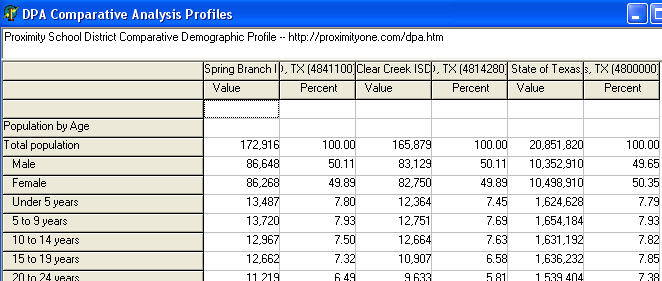
Comparative Analysis Excel File Results As the comparative analysis is displayed to the screen, an Excel file is also generated. A portion of the Excel file display is shown in the following graphic. 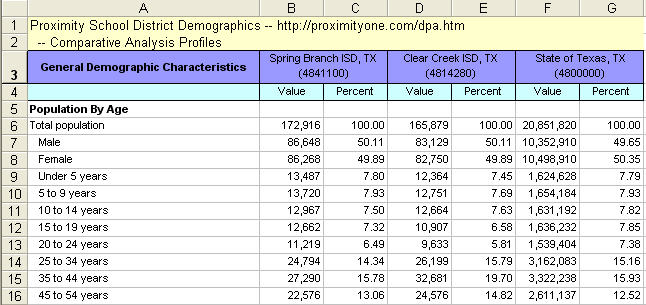
Socioeconomic Status (SES) Indicators This flexible SES analysis feature has been developed as there is no one, best way to assign and assess SES factors for all districts and areas. Combinations of conditions make it useful to be able to assess different factors for different areas. These data are drawn from the database tables listed below. These are the same four data sources used to generate the comparative analysis displays. • General demographics items (DP1) • Social characteristics items (DP2) • Economic characteristics items (DP3) • Housing characteristics items (DP4) Alternative socioeconomic status indicators and ranking factors are described below. • Poverty (individuals) • Housing Costs to Income • Foreign Born • Limited English Proficiency • Female Single Parent Family The higher the value taken on by the SES indicator, the higher the "challenge index" for that district relative to other districts in the peer group. In these examples, the master peer group is Texas statewide -- all school districts in Texas. The master peer group may be further narrowed in scope by selecting districts based on total population size. In the following sample displays, Spring Branch ISD ranks "near the middle" of all districts in the state based on the incidence of total persons living in poverty (547th of 1,040 districts). This may be contrasted to the ranking based on Limited English Proficiency. As shown in the display presented below, Spring Branch ISD ranks 971 of the total 1,040 districts. These data suggest that Limited English Proficiency has a much higher relative (to all other districts) incidence than Poverty. Poverty (individuals) Factor Indicator basis: dp3058 (from Economic characteristics items) Example of Poverty (individuals) SES Display 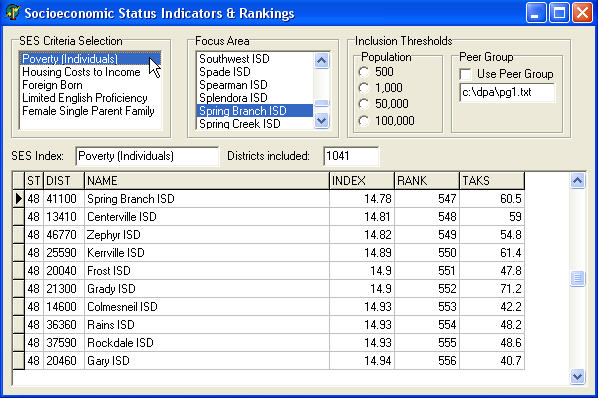
Housing Costs to Income Factor Indicator basis: dp4074 (from Social characteristics items) to dp3058 (from Economic characteristics items) district relative to state Foreign Born Factor dp2056 to dp2046 (both from Social characteristics items) district relative to state Limited English Proficiency Factor dp2066 to dp2063 ( both from Social characteristics items) district relative to state Example of Limited English Proficiency SES Display This application shows use of the "population inclusion threshold." The minimum population value of 1,000 is selected. As a result, only those districts with population of 1,000 or more are included in the ranking. Note that 899 districts meet this criteria. 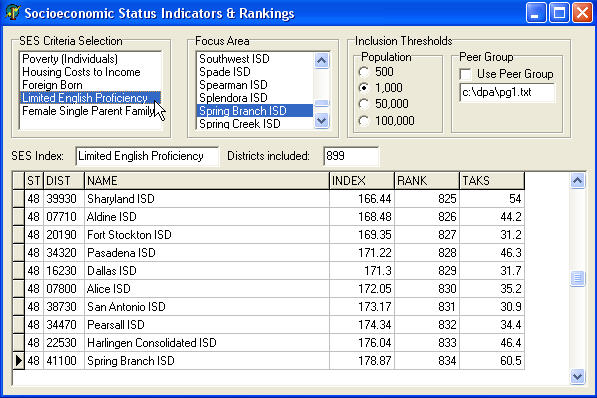
Female Single Parent Family Factor dp1078 to dp1073 (both from General demographics items) district relative to state Example of Female Single Parent Family SES Display This application shows use of the "peer group inclusion constraint." The Peer Group checkbox is checked resulting in only those districts listed in the peer group control file to be included in the ranking. Four areas are listed in the peer group control file. 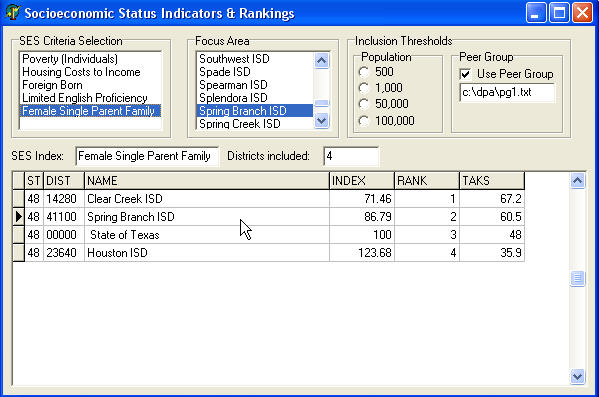
Linking to the Texas Assessment of Knowledge and Skills (TAKS) When viewing an SES ranking, the 2003 TAKS data may be displayed for any area listed in the ranking. To view the ranking summary table, double-click the area of interest in the ranking table. The 2003 TAKS data will appear for that district. The following example shows the display produced when the Spring Branch ISD row/line is clicked viewing the display shown in the graphic presented above. The availability of this feature depends on the availability and structure of assessment data which vary from state to state. 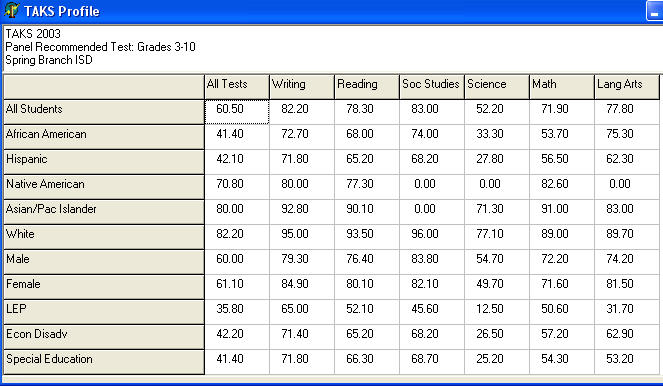
Operation When the program executes, the main interface screen appears as shown above. Comparative Analysis Profile. If you click the button "Create DP1-4", four profiles are displayed on the screen in a sequence. At the same time, the profiles are written to an Excel file with name and location as specified on the program menu screen. The program generates the profiles for the areas listed in the "Active Areas" panel. The Excel file should be considered to be the primary output. The Excel file is generated as a set of 4 sheets, corresponding to the four demographic profiles. The Excel file named in the DPA menu screen must be closed before DPA can output to that file name. If the file named is open, an error will occur. Proceed as follows to make a different school district selection. From the main menu window, click in a radio button to designate the active area (state or school district) being selected. For example, if you click on the Area 1 button, you would be selecting the first area. To select the area (make it active), use the Area Selection listbox. Locate the area (e.g., school district) of interest and double-click that name. The area name will then appear in the respective area edit box (e.g., Area 1). Socioeconomic Indicators Analysis. If you click the button "SES Analysis", the SES Analysis window appears as shown above.
Contact Proximity for more information about acquiring school district demographic profiles and SES analyses for areas of interest. [goto top] |
|
|