|
|
|
School District Demographic Trend Analysis Profiles 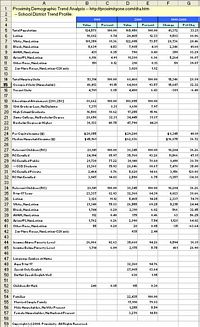 Assess 1990 to 2000 demographic trends using the school district demographic trend profiles
developed using the new School District Demographic Trend Analyst (DTA).
DTA is an integrated software and data resource
developed by Proximity to generate short- and long-term school district demographic analysis profiles. This Web page describes the scope and use
of the 1990 to 2000 demographic profile produced by DTA.
Assess 1990 to 2000 demographic trends using the school district demographic trend profiles
developed using the new School District Demographic Trend Analyst (DTA).
DTA is an integrated software and data resource
developed by Proximity to generate short- and long-term school district demographic analysis profiles. This Web page describes the scope and use
of the 1990 to 2000 demographic profile produced by DTA.
The sample profile shown at the right provides a summary of key 1990 Census and Census 2000 School District Special Tabulation data. The profile provides a snapshot overview of the demographic characteristics of a school district in 1990, 2000, and the change between 1990 and 2000. The profile provides a summary of characteristics of the "school district community" as well as the "grade relevant school age population" of the district. DTA generates the profile as a screen display and outputs the profile to an Excel spreadsheet file. Sample Excel Files Cleveland MSD, OH Columbus, OH Dallas ISD, TX Los Angeles Unified, CA Using the DTA Profile Click on the Los Angeles Unified sample Excel profile that will open in a separate Web page. The profile is organized with three sets of two columns (1990 Census, 2000 Census, and change 1990 to 2000). Data sources and limitations. Data presented in the profile are based mainly on the decennial census long form questionnaire. These data are estimates based on a sample of the population and therefore subject to sampling and non-sampling errors. In general the smaller the population, the less reliable the data become. "School District Community" Characteristics [goto top] Data for the "school district community" describe attributes of the total population in the school district territory. Rows 1 through 25 provide characteristics of the school district community. Comparing 1990 and 2000 Race/Ethnicity [goto top] Race and ethnicity data are provided for Hispanic/Latino and by race for the Non-Latino population for the "school district community" and "relevant children". Collection and tabulation of race data differs between the 1990 Census and Census 2000. In Census 2000, respondents were able to identify their race from a selection including two or more races. As a result, the DTA profile shows a cell for the year 2000 "2 or More Races" which is not available for 1990. Though typically a small number, the separation of the "2 or more races" population group makes the race data for the other six categories between 1990 and 2000 not totally comparable. Educational Attainment [goto top] Educational attainment data are provided from the 1990 Census for the total population ages 20 and over and the Census 2000 total population ages 25 and over. As the underlying universe differs substantially between 1990 and 2000, no 1990 to 2000 trend data are shown. Children and Type of Enrollment [goto top] Rows 27 through 32 summarize the number of children by type of enrollment. Total Children. For Census 2000, a child is defined as a person age less than one year to 17 or a person age 18 or 19 who is not a high school graduate (based on the educational attainment response from the Census 2000 questionnaire). The definition slightly differs from the child definition used in the 1990 school district tabulation in two ways. First, the 1990 definition of children does not include people ages 0 to 2. Second, the 1990 tabulation does not include high school graduates under age 18 as children. Relevant Children. A child is relevant to a school district if he/she lives within the territory of the district and his/her assigned grade falls within the grade range provided by a district. Relevant Children Enrolled. The relevant children enrolled tabulation is the sum of relevant children enrolled in public school and relevant children enrolled in private school. Relevant Children Enrolled in Public School. Relevant children enrolled in public school. Relevant Children Enrolled in Private School. Relevant children enrolled in private school. Relevant Children Not Enrolled. Relevant children not enrolled in school (RCNE) is the number of relevant children less the number of relevant children enrolled in school. Characteristics of Relevant Children [goto top] Rows 34 and higher provide characteristics of "grade relevant school age children" in the district. These children are 3-to-19 years of age, for ages that are grade relevant to the particular district, and include only 18 and 19 year olds who are not high school graduates. The 1990 tabulation does not include high school graduates under age 18 as children. Children Enrolled in Public School. Row 29 presents data on the number of relevant children enrolled in public school. The total number of students reported by the school district as enrolled for the respective school year (e.g., school year 1989-90 for the 1990 data) is shown in row 30. The administratively reported data is taken from the National Center for Education Statistics Common Core of Data which is a collection of the data reported by all states. Children in Poverty [goto top] Rows 44 and 45 show the number of relevant children by poverty status. The official poverty measure has two components: poverty thresholds (income levels) and the family income that is compared to these thresholds. The official definition uses 48 thresholds that take into account family size and presence and number of family members under 18 years of age. Poverty data are not adjusted for cost of living differences between regions/areas. Family income determines who is poor. If the family's income is less than the threshold for the family's size and composition, then the family and everyone in the family are considered "poor." The total number of children below the poverty level is the sum of the number of children in poor families and the number of unrelated individuals (children) with incomes below the poverty threshold. Census 2000, for example, asked people about their income in the previous calendar year. For Census 2000 determination of children in poverty, the family income in 1999 was compared with the corresponding 1999 poverty thresholds. The following tables present the poverty thresholds used for Census 2000 and the 1990 Census and illustrative differences of the distribution and change of the population in poverty between 1989 and 1999.
English Proficiency [goto top] Rows 47 through 50 show attributes of relevant children relating to their English proficiency. These data are based on language spoken at home. The data for "Do Not Speak English Well" includes those persons who "do not speak English well" and "do not speak English at all" on the questionnaire. Children At-Risk [goto top] Row 52 shows the number of relevant children at-risk. Definitions for the at-risk population are described below. For the 1990 Census, data tabulated for the at-risk population were tabulated using the total population universe. For Census 2000, the tabulations are based on the relevant children population. For non-unified school districts, the data will not be comparable between 1990 and 2000. 1990 Census definition. Children 4 to 19 years of age living with mother who was less than 20 years old when child was born, mother not high school graduate, mother single, divorced or separated, mother below poverty level in 1989. Census 2000 definition. Relevant children living with mother who was not high school graduate and single, divorced, or separated and was below poverty level in 1999. Single Parent Families Rows 54 through 57 show attributes of relevant children by type of family. These measures show the number of relevant children living in families with a single parent. These data are derived from the Census 2000 SDST Households with Children tabulation universe for total relevant children (Table P15). Additional Information Contact Proximity for more information about acquiring school district demographic trend profiles for areas of interest. [goto top] | ||||||||||||||||||||||||||||||||||||||||||||||||||||||||||||||||||||||||||||||||||||||||||||||||||||||||||||||||||||||||||||||||||||||||||||||||||||||||||||||||||||||||||||||||||||||||||||||||||||||||||||||||||||||||||||||||||||||||||||||||||||||||||||||||||||||||||||||||||||||||||||||||||||||||||||||||||||||||||||||||||||||||||||||||||||||||||||||||||||||||||||||||||||||||||||||||||||||||||||||||||||||||||||||||||||||||||||||||||||||||||||||||||||||||||||||||||||||||||||||||||
|
|