Language Use

Contents
Selected CV XE GIS project/application views in Texas.
Click toggle in Table of Contents at left to view sub-state applications.
Integrating shapefiles, ACS demographics, Census 2010 demographics, estimates & projections and related data.
See related interactive ranking tables:
| • | Texas school district demographics: http://proximityone.com/tx_sdc.htm. |
| • | Texas census tract demographics: http://proximityone.com/tracts11dp1.htm. |
| • | Census 2010 demographics: http://proximityone.com/s&o_comparative_profiles.htm |
(all US geography: state, congressional district, county, school district, city/place, metro)
Join the conversation .. ProximityOne on Twitter -- https://twitter.com/ProximityOne
The toggle graphic -- ![]() -- indicates an expanding section. Click the toggle or toggle line to view/close expanding sections.
-- indicates an expanding section. Click the toggle or toggle line to view/close expanding sections.
Language Spoken at Home by School District Percent population 5 years and older who speak language other than English at home & do not speak English very well Percent computed as 100 * item S113 / item S110 (see item listing at http://proximityone.com/dep2.htm ) Data based on 2009 American Community Survey (http://proximityone.com/acs.htm) 5-year estimates, centric to mid-2007. See interval/color pattern in highlighted layer (blue) in legend at left of map.
|
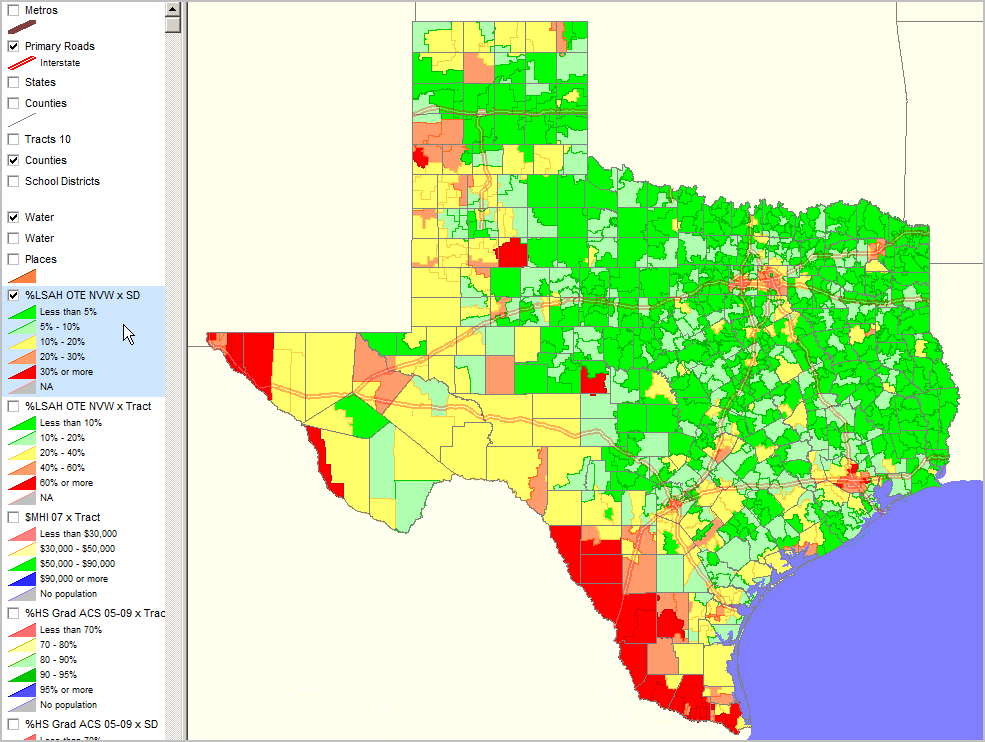
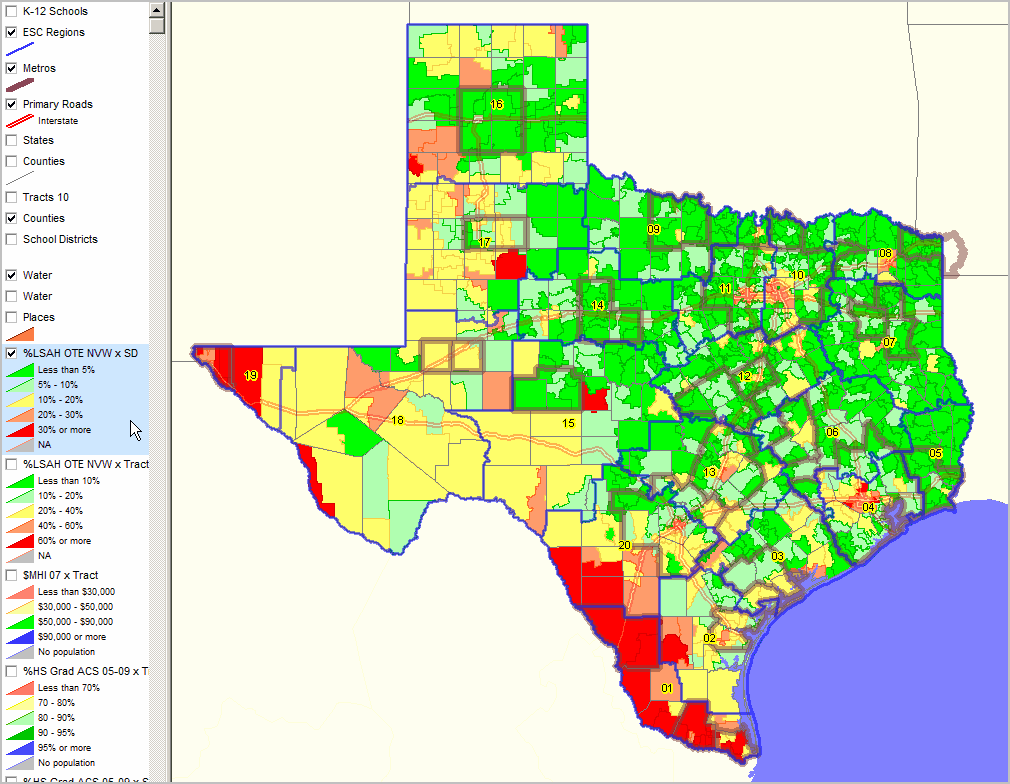
Language Spoken at Home by School District Percent population 5 years and older who speak language other than English at home & do not speak English very well Percent computed as 100 * item S113 / item S110 (see item listing at http://proximityone.com/dep2.htm ) Data based on 2009 American Community Survey (http://proximityone.com/acs.htm) 5-year estimates, centric to mid-2007. See interval/color pattern in highlighted layer (blue) in legend at left of map.
Metros - bold semi transparent brown boundary Education Service Areas - bold blue boundary with ESC region number as label
|
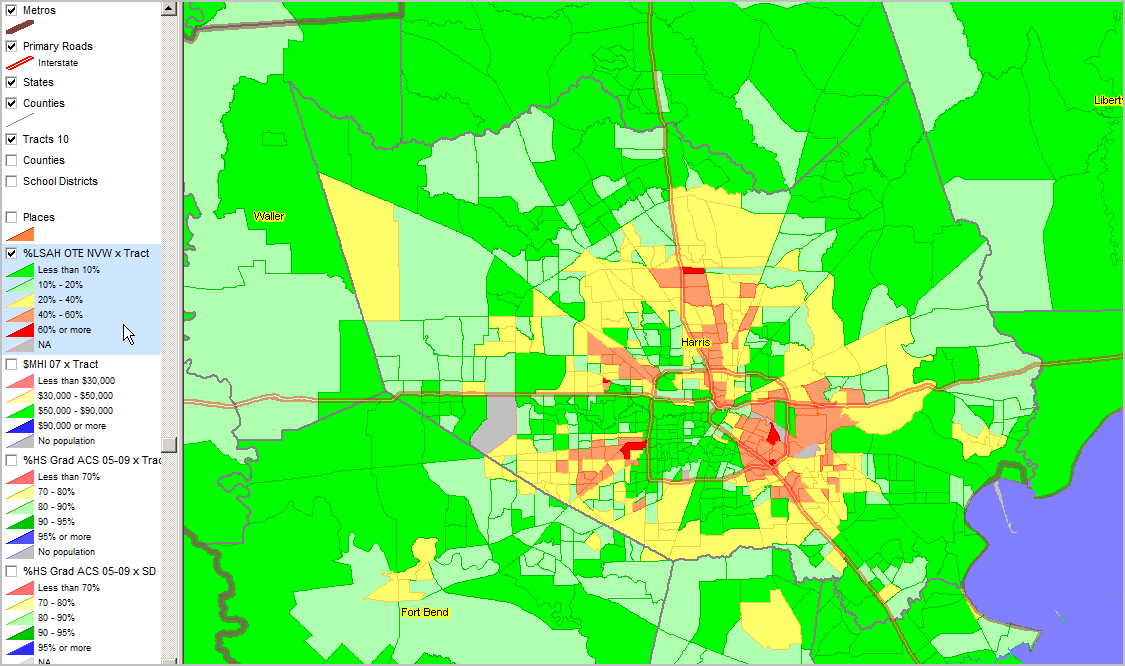
Language Spoken at Home by Census Tract Percent population 5 years and older who speak language other than English at home & do not speak English very well Percent computed as 100 * item S113 / item S110 (see item listing at http://proximityone.com/dep2.htm ) Data based on 2009 American Community Survey (http://proximityone.com/acs.htm) 5-year estimates, centric to mid-2007. See interval/color pattern in highlighted layer (blue) in legend at left of map.
Harris County/Houston area
|
Language Spoken at Home by Census Tract Percent population 5 years and older who speak language other than English at home & do not speak English very well Percent computed as 100 * item S113 / item S110 (see item listing at http://proximityone.com/dep2.htm ) Data based on 2009 American Community Survey (http://proximityone.com/acs.htm) 5-year estimates, centric to mid-2007. See interval/color pattern in highlighted layer (blue) in legend at left of map.
Dallas Area
|
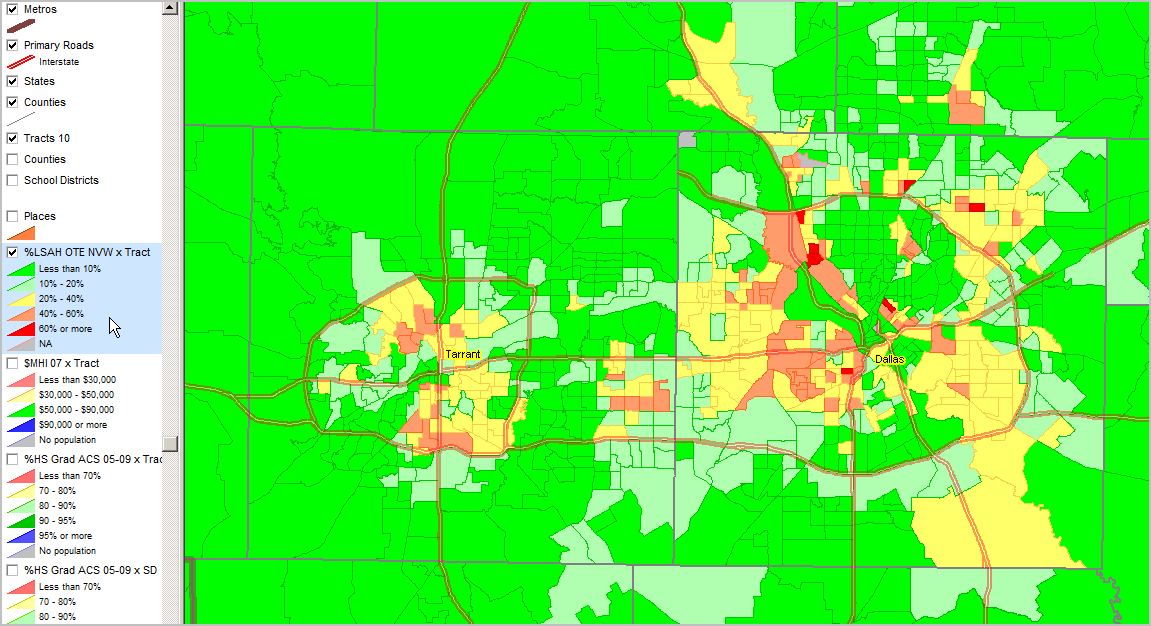
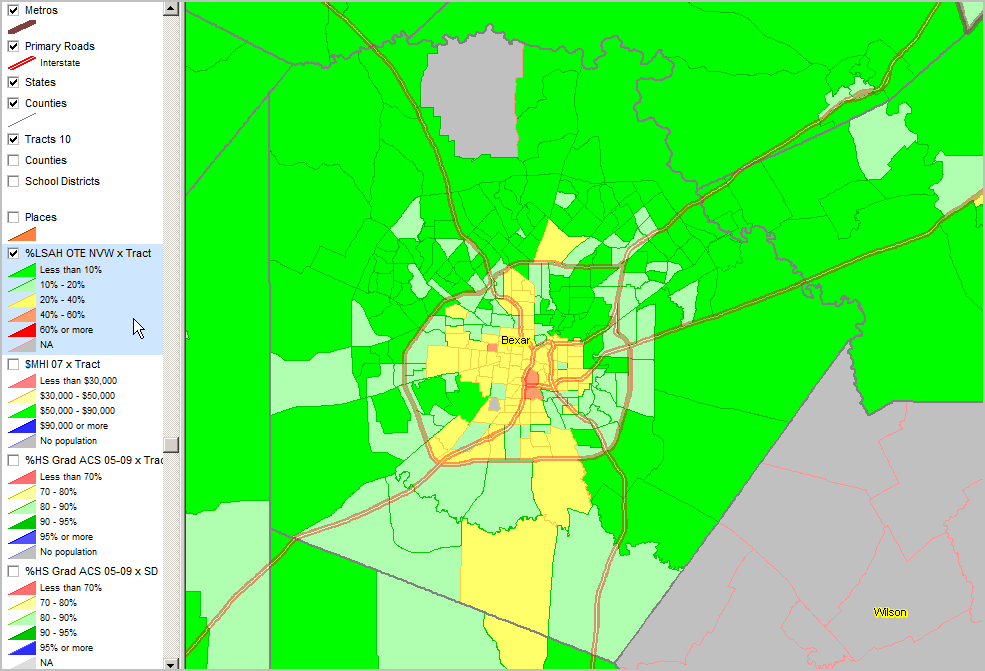
Language Spoken at Home by Census Tract Percent population 5 years and older who speak language other than English at home & do not speak English very well Percent computed as 100 * item S113 / item S110 (see item listing at http://proximityone.com/dep2.htm ) Data based on 2009 American Community Survey (http://proximityone.com/acs.htm) 5-year estimates, centric to mid-2007. See interval/color pattern in highlighted layer (blue) in legend at left of map.
San Antonio Area
|