|
|
|
HighLevelIndustryAnalyst
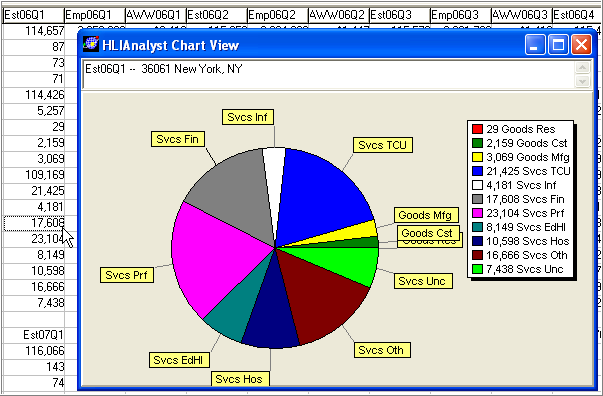
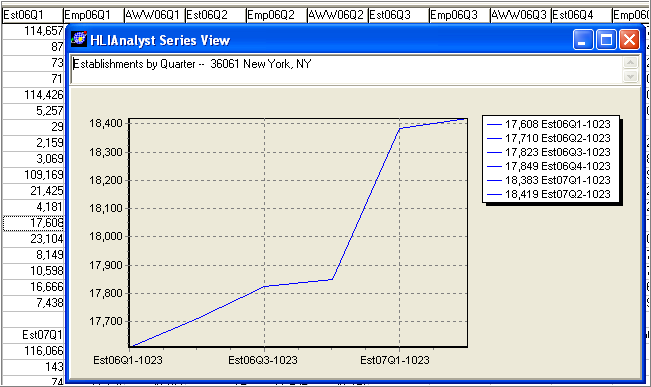
Use HLIA to answer questions like: • What is the industrial/type of business/ make-up of counties or regions interest? • How has the economy of these areas changed by quarter during the past year? • What do these trends and industrial composition attributes suggest about the future? • What areas are changing, how fast, and by what amount and what might he impact be? • How do the composition and trends for one county/region compare to others? HLIA is ultra-easy to use. Click a county and the profile displays. Select a different view (percentages) and see the distribution by percentages. The following HLIA graphic shows quarterly data for New York, NY (Manhattan): the number of establishments (est06q1), employment (emp06q1) and average weekly wages (aww06q1) for high level industries for the first quarter of 2006. As of April 2008, HLIA includes an seven quarter series running through third quarter 2007. The fourth quarter 2007 data will be added in July 2008.
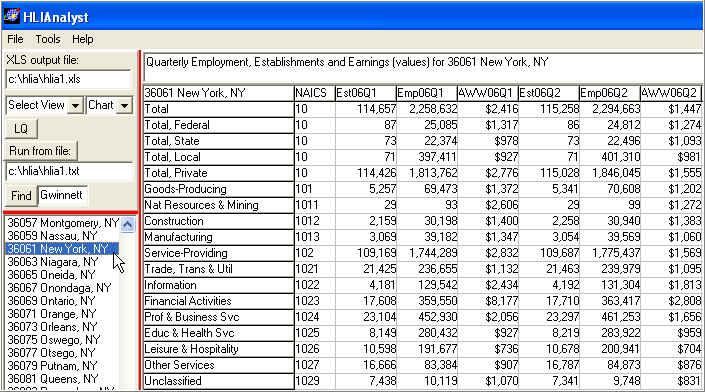 click for larger view then press F11 key HLIA uses employer data, reported and tabulated quarterly, on the number of establishments, employment, and average weekly earnings by industrial category. The database is updated quarterly by Proximity using the "ES-202" data tabulated by the U.S. Bureau of Labor Statistics. These data have only a 7-to-8 month lag between the data of reference and date of access in HLIA. View data for a single county or aggregates for any county grouping. Click in the listbox of counties to select one county; or click on several counties to multi-select and aggregate dynamically. Optionally run multi-county selections from county list file. View data as as point-and-click, on-demand graphics including time series charts (any item over all time periods) and pie charts (industry composition, any period) as shown below.
 click for larger view then press F11 key
The fee-based HLIA includes the ability to: • Download quarterly database updates. • Save display to Excel file. • Export data for mapping with CommunityViewer. • Export times-series data structure suitable for modeling and time-series analysis. • View data series as chart graphic - just click a display cell. • Perform queries to locate counties meeting certain conditions. • Rank counties based on user specified fields. • Aggregate data for counties, then perform above operations on multi-county aggregated area. • Optionally estimate suppressed data cells (data for some cells suppressed for purposes of confidentiality). Fee-based HLIA users also have access to telephone and e-mail support. Register to get started now. Use the Contact Proximity form and key in "HLIA" in the message section. Industry Classifications. Economic data such as the number of establishments, employment and earnings are often defined/grouped by the North American Industrial Classification System (NAICS). High Level, or Level 1, industries are the highest/most aggregated/ level of industry grouping (e.g., Manufacturing, Retail Trade, etc.). More detailed levels (2, 3, etc.) provide more specific industry groupings, or “sub-sectors” (such as Plastics Products, Textile Products, Transportation Equipment, each within the Manufacturing High Level Industry and Coal Mining and Oil and Gas Extraction, each within the Natural Resources and Mining High Level Industry). Contact Proximity for more information. | ||||||||||||||||||
|
|