
|
|
|
Updated April 2014. The list of the largest 100 school districts now includes 2013-14 school year data. This section includes an interactive table to view characteristics of each/all of these districts and a district-specific section with district map graphics and related data. Extended data for each district provide related demographic-economic estimates and projections to help stakeholders gain insights into the how, where, when and by how much change will occur and assess potential impacts. New to the largest 100 list are Klein ISD, TX (Houston area) and Round Rock ISD, TX (Austin area). Use the interactive table below to view/rank/compare the 100 largest districts based on 2013-14 enrollment. Select by state or metropolitan area of interest using the filters below the table. Click a link in a school district row to immediately navigate to a map graphic and related links/attributes for that district, illustrated in the Atlanta section. Sample Section for Atlanta Public Schools, GA
2013-14 school year enrollment: 49,796
Map shows patterns of economic prosperity by neighborhood. .. ACS 2012 5-year median household income for district overall: $46,146  School district bold black boundary; click graphic for larger view View developed using CV XE GIS and Georgia DMI GIS Project. Click this link to view detailed 5-part demographic-economic characteristics. See related Atlanta community profile. See related Fulton county projections to 2020. Largest 100 School Districts -- interactive table Click ShowAll button between Find/Queries. Use mouseover on column header to view column description. See ranking table usage notes below ranking table. See related ranking tables -- http://proximityone.com/rankingtables.htm. Usage Notes • Click ShowAll button between specific area queries. • Click school district code link to navigate to that section. • Dbl-click column header cell to sort; click again to sort in other direction. Albuquerque Public Schools, NM gotop 2013-14 school year enrollment: 92,315 Map shows patterns of economic prosperity by neighborhood. .. ACS 2012 5-year median household income for district overall: $48,497. 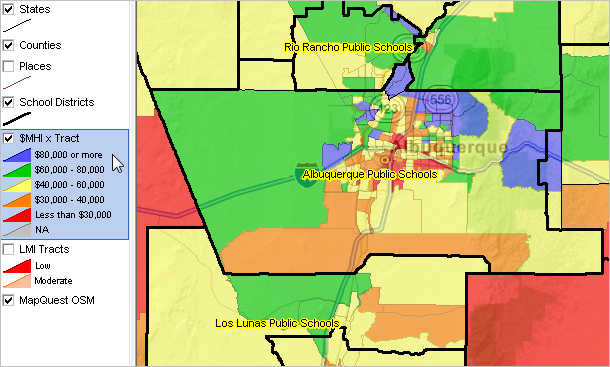 School district bold black boundary; click graphic for larger view View developed using CV XE GIS and New Mexico DMI GIS Project. Click this link to view detailed 5-part demographic-economic characteristics for this school district. See related Albuquerque community profile. See related Bernalillo county projections to 2020. Aldine ISD, TX gotop 2013-14 school year enrollment: 67,381 Map shows patterns of economic prosperity by neighborhood. .. ACS 2012 5-year median household income for district overall: $37,107 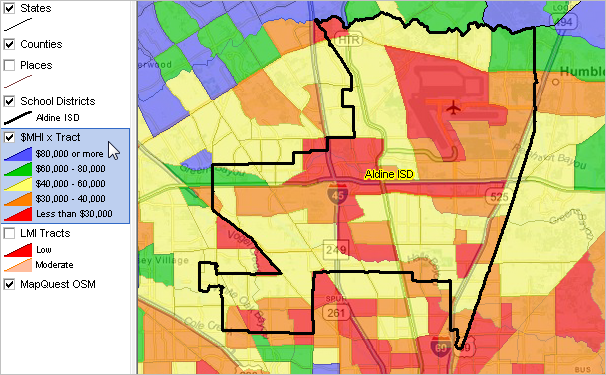 School district bold black boundary; click graphic for larger view View developed using CV XE GIS and Texas DMI GIS Project. Click this link to view detailed 5-part demographic-economic characteristics for this school district. See related Aldine CDP community profile. See related Harris county projections to 2020. Alpine School District, UT gotop 2013-14 school year enrollment: 72,419 Map shows patterns of economic prosperity by neighborhood. .. ACS 2012 5-year median household income for district overall: $41,396. 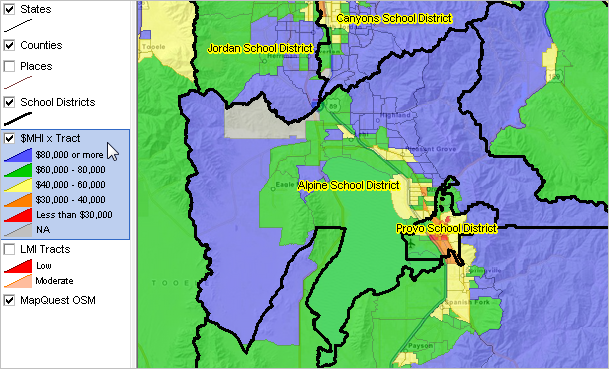 School district bold black boundary; click graphic for larger view View developed using CV XE GIS and Texas DMI GIS Project. Click this link to view detailed 5-part demographic-economic characteristics for this school district. See related Alpine community profile. See related Utah county projections to 2020. Anchorage School District, AK gotop 2013-14 school year enrollment: 48,213 Map shows patterns of economic prosperity by neighborhood. .. ACS 2012 5-year median household income for district overall: $76,495.  School district bold black boundary; click graphic for larger view View developed using CV XE GIS and Alaska DMI GIS Project. Click this link to view detailed 5-part demographic-economic characteristics for this school district. See related Anchorage Municipality community profile. See related Anchorage Municipality projections to 2020. Anne Arundel County Public Schools, MD gotop 2013-14 school year enrollment: 75,481 Map shows patterns of economic prosperity by neighborhood. .. ACS 2012 5-year median household income for district overall: $86,987. 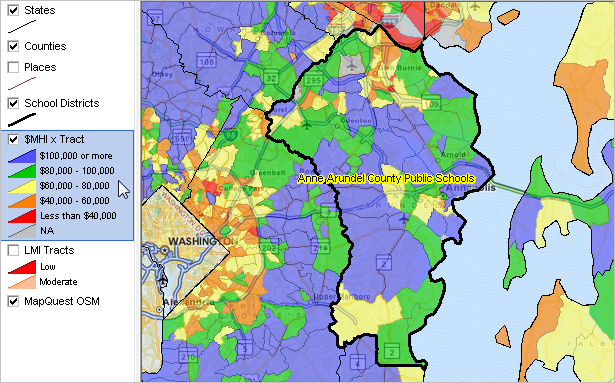 School district bold black boundary; click graphic for larger view View developed using CV XE GIS and Maryland DMI GIS Project. Click this link to view detailed 5-part demographic-economic characteristics for this school district. See related Annapolis community profile. See related Anne Arundel county projections to 2020. Arlington ISD, TX gotop 2013-14 school year enrollment: 64,688 Map shows patterns of economic prosperity by neighborhood. .. ACS 2012 5-year median household income for district overall: $50,893 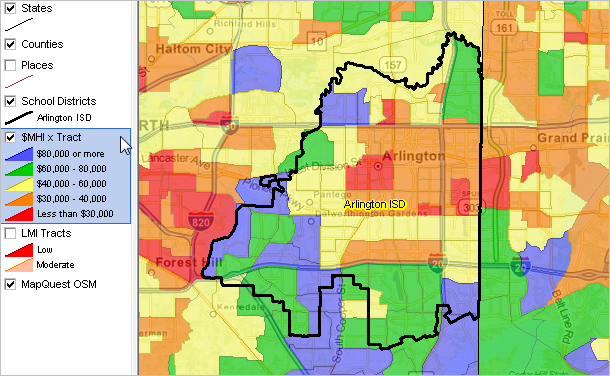 School district bold black boundary; click graphic for larger view View developed using CV XE GIS and Texas DMI GIS Project. Click this link to view detailed 5-part demographic-economic characteristics for this school district. See related Arlington community profile. See related Tarrant county projections to 2020. Atlanta Public Schools, GA gotop 2013-14 school year enrollment: 49,796 Map shows patterns of economic prosperity by neighborhood. .. ACS 2012 5-year median household income for district overall: $46,146 School district bold black boundary; click graphic for larger view View developed using CV XE GIS and Georgia DMI GIS Project. Click this link to view detailed 5-part demographic-economic characteristics for this school district. See related Atlanta community profile. See related Fulton county projections to 2020. Austin ISD, TX gotop 2013-14 school year enrollment: 85,372 Map shows patterns of economic prosperity by neighborhood. .. ACS 2012 5-year median household income for district overall: $50,835. 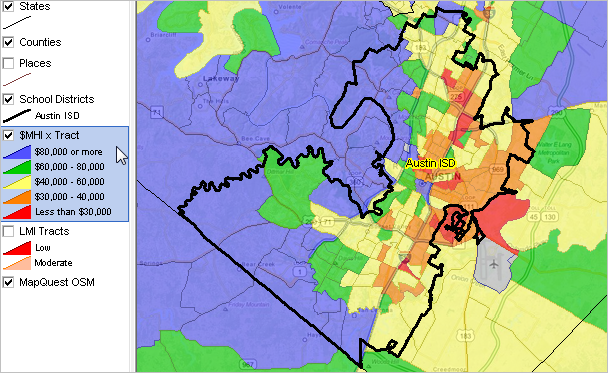 School district bold black boundary; click graphic for larger view View developed using CV XE GIS and Texas DMI GIS Project. Click this link to view detailed 5-part demographic-economic characteristics for this school district. See related Austin community profile. See related Travis county projections to 2020. Baltimore City Public Schools, MD gotop 2013-14 school year enrollment: 84,730 Map shows patterns of economic prosperity by neighborhood. .. ACS 2012 5-year median household income for district overall: $40,803. 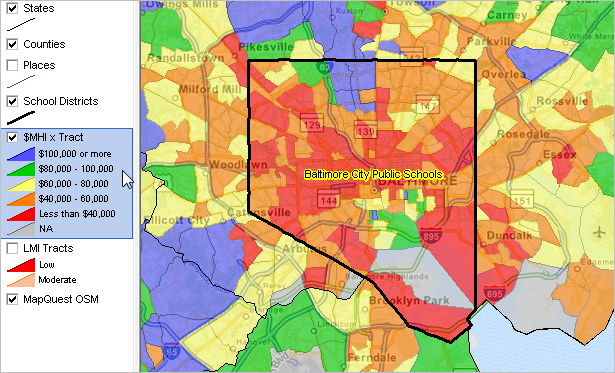 School district bold black boundary; click graphic for larger view View developed using CV XE GIS and Maryland DMI GIS Project. Click this link to view detailed 5-part demographic-economic characteristics for this school district. See related Baltimore community profile. See related Baltimore independent city county projections to 2020. Baltimore County Public Schools, MD gotop 2013-14 school year enrollment: 108,376 Map shows patterns of economic prosperity by neighborhood. .. ACS 2012 5-year median household income for district overall: $66,068. 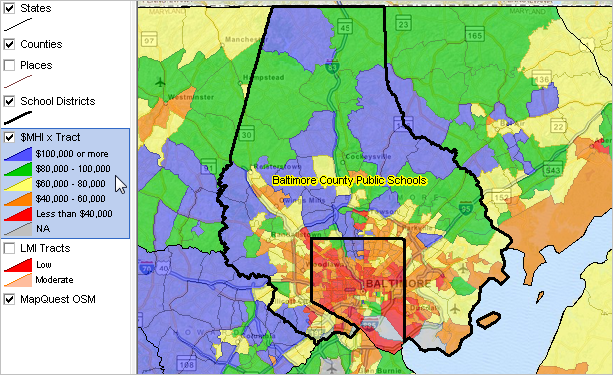 School district bold black boundary; click graphic for larger view View developed using CV XE GIS and Maryland DMI GIS Project. Click this link to view detailed 5-part demographic-economic characteristics for this school district. See related Baltimore community profile. See related Baltimore county projections to 2020. Boston Public Schools, MA gotop 2013-14 school year enrollment: 54,300 Map shows patterns of economic prosperity by neighborhood. .. ACS 2012 5-year median household income for district overall: $53,136. 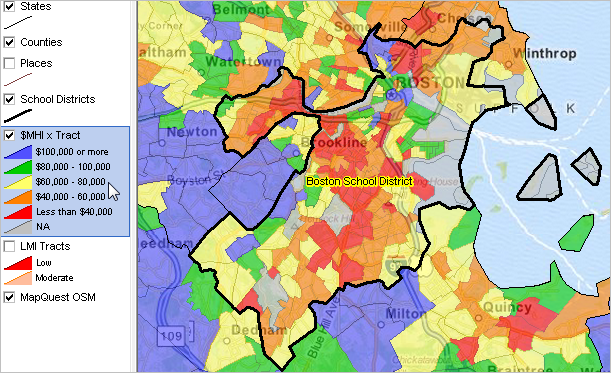 School district bold black boundary; click graphic for larger view View developed using CV XE GIS and Massachusetts DMI GIS Project. Click this link to view detailed 5-part demographic-economic characteristics for this school district. See related Boston community profile. See related Suffolk county projections to 2020. Brevard County Public Schools, FL gotop 2013-14 school year enrollment: 71,224 Map shows patterns of economic prosperity by neighborhood. .. ACS 2012 5-year median household income for district overall: $49,099. 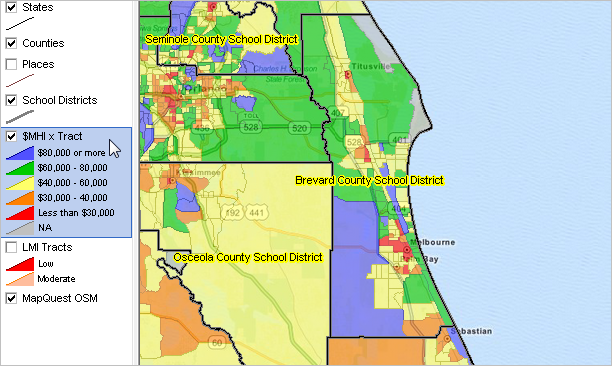 School district bold black boundary; click graphic for larger view View developed using CV XE GIS and Florida DMI GIS Project. Click this link to view detailed 5-part demographic-economic characteristics for this school district. See related Melbourne community profile. See related Brevard county projections to 2020. Broward County Public Schools, FL gotop 2013-14 school year enrollment: 262,680 Map shows patterns of economic prosperity by neighborhood. .. ACS 2012 5-year median household income for district overall: $51,603. 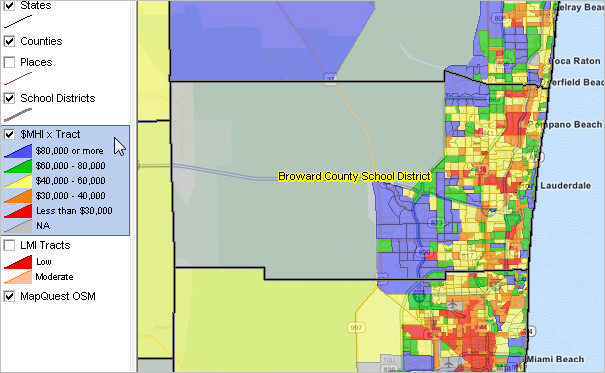 School district bold black boundary; click graphic for larger view View developed using CV XE GIS and Florida DMI GIS Project. Click this link to view detailed 5-part demographic-economic characteristics for this school district. See related Fort Lauderdale community profile. See related Broward county projections to 2020. Brownsville ISD, TX gotop 2013-14 school year enrollment: 49,370 Map shows patterns of economic prosperity by neighborhood. .. ACS 2012 5-year median household income for district overall: $29,677. 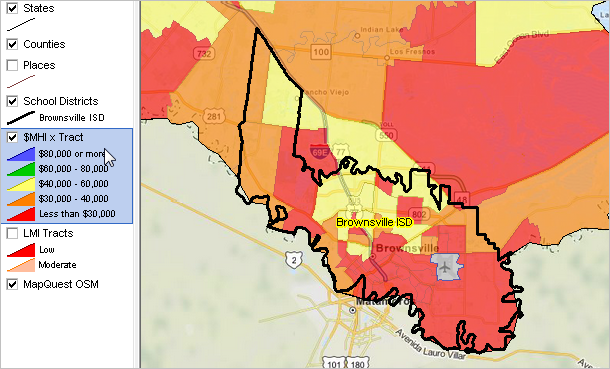 School district bold black boundary; click graphic for larger view View developed using CV XE GIS and Texas DMI GIS Project. Click this link to view detailed 5-part demographic-economic characteristics for this school district. See related Brownsville community profile. See related Cameron county projections to 2020. Capistrano Unified School District, CA gotop 2013-14 school year enrollment: 53,000 Map shows patterns of economic prosperity by neighborhood. .. ACS 2012 5-year median household income for district overall: $97,410. 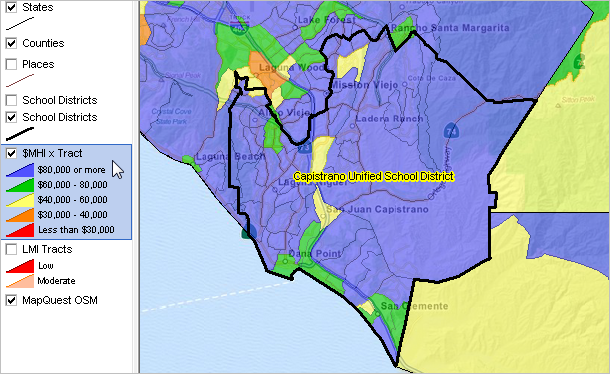 School district bold black boundary; click graphic for larger view View developed using CV XE GIS and California DMI GIS Project. Click this link to view detailed 5-part demographic-economic characteristics for this school district. See related San Juan Capistrano community profile. See related Orange county projections to 2020. Charlotte-Mecklenburg Schools, NC gotop 2013-14 school year enrollment: 135,953 Map shows patterns of economic prosperity by neighborhood. .. ACS 2012 5-year median household income for district overall: $55,961. 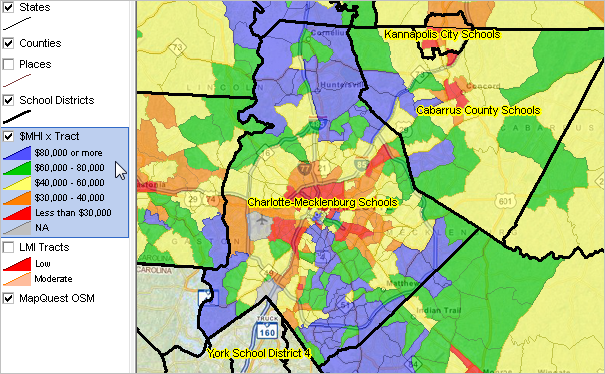 School district bold black boundary; click graphic for larger view View developed using CV XE GIS and North Carolina DMI GIS Project. Click this link to view detailed 5-part demographic-economic characteristics for this school district. See related Charlotte community profile. See related Mecklenburg county projections to 2020. Cherry Creek School District, CO gotop 2013-14 school year enrollment: 54,226 Map shows patterns of economic prosperity by neighborhood. .. ACS 2012 5-year median household income for district overall: $70,219. 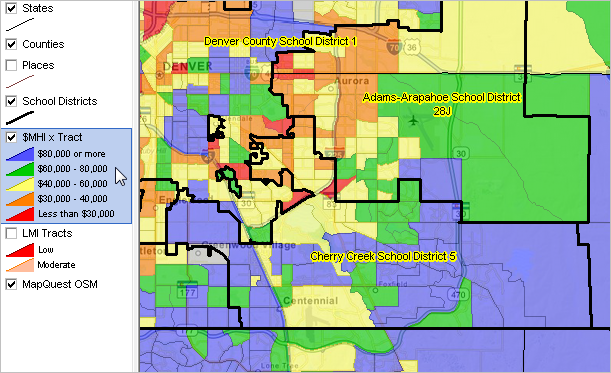 School district bold black boundary; click graphic for larger view View developed using CV XE GIS and Colorado DMI GIS Project. Click this link to view detailed 5-part demographic-economic characteristics for this school district. See related Centennial community profile. See related Arapahoe county projections to 2020. Chesterfield County Public Schools, VA gotop 2013-14 school year enrollment: 59,186 Map shows patterns of economic prosperity by neighborhood. .. ACS 2012 5-year median household income for district overall: $72,363. 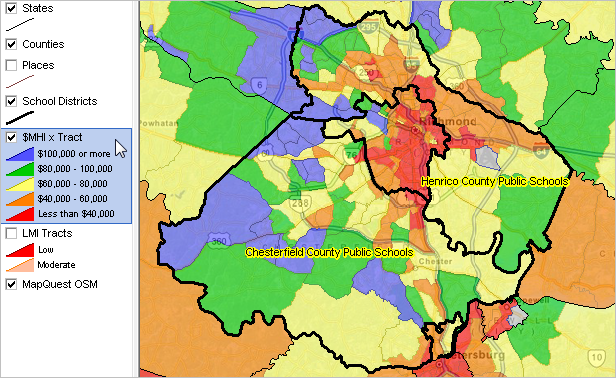 School district bold black boundary; click graphic for larger view View developed using CV XE GIS and Virginia DMI GIS Project. Click this link to view detailed 5-part demographic-economic characteristics for this school district. See related Richmond community profile. See related Chesterfield county projections to 2020. Chicago Public Schools, IL gotop 2013-14 school year enrollment: 400,994 Map shows patterns of economic prosperity by neighborhood. .. ACS 2012 5-year median household income for district overall: $47,409. 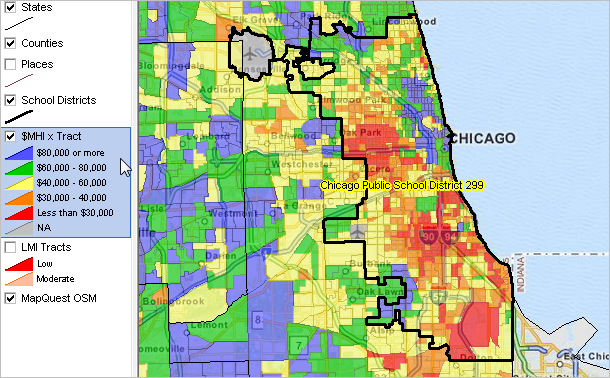 School district bold black boundary; click graphic for larger view View developed using CV XE GIS and Illinois DMI GIS Project. Click this link to view detailed 5-part demographic-economic characteristics for this school district. See related Chicago community profile. See related Cook county projections to 2020. Clark County School District, NV gotop 2013-14 school year enrollment: 314,643 Map shows patterns of economic prosperity by neighborhood. .. ACS 2012 5-year median household income for district overall: $54,218. 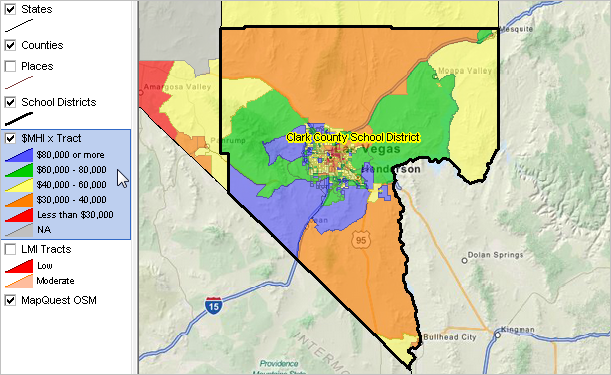 School district bold black boundary; click graphic for larger view Click this link to view detailed 5-part demographic-economic characteristics for this school district. See related Las Vegas community profile. See related Clark county projections to 2020. Clayton County Public Schools, GA gotop 2013-14 school year enrollment: 50,366 Map shows patterns of economic prosperity by neighborhood. .. ACS 2012 5-year median household income for district overall: $42,569. 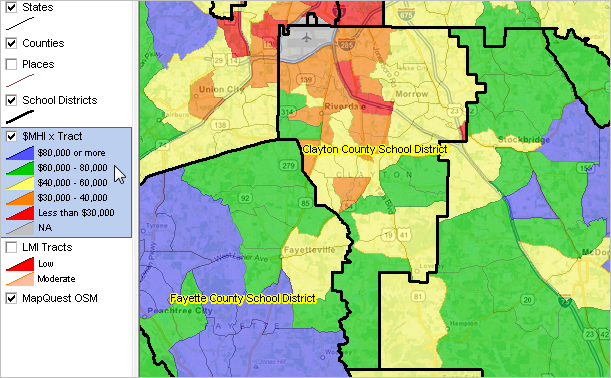 School district bold black boundary; click graphic for larger view View developed using CV XE GIS and Georgia DMI GIS Project. Click this link to view detailed 5-part demographic-economic characteristics for this school district. See related Morrow community profile. See related Clayton county projections to 2020. Cobb County School District, GA gotop 2013-14 school year enrollment: 107,315 Map shows patterns of economic prosperity by neighborhood. .. ACS 2012 5-year median household income for district overall: $62,634.  School district bold black boundary; click graphic for larger view View developed using CV XE GIS and Georgia DMI GIS Project. Click this link to view detailed 5-part demographic-economic characteristics for this school district. See related Kennesaw community profile. See related Cobb county projections to 2020. Columbus City School District, OH gotop 2013-14 school year enrollment: 51,000 Map shows patterns of economic prosperity by neighborhood. .. ACS 2012 5-year median household income for district overall: $36,856.  School district bold black boundary; click graphic for larger view View developed using CV XE GIS and Ohio DMI GIS Project. Click this link to view detailed 5-part demographic-economic characteristics for this school district. See related Columbus community profile. See related Delaware county projections to 2020. Conroe ISD, TX gotop 2013-14 school year enrollment: 55,009 Map shows patterns of economic prosperity by neighborhood. .. ACS 2012 5-year median household income for district overall: $69,404. 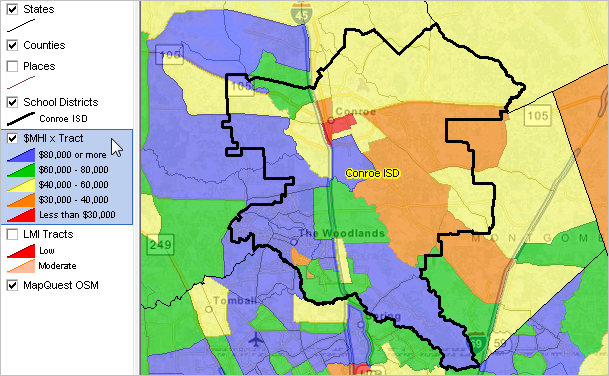 School district bold black boundary; click graphic for larger view View developed using CV XE GIS and Texas DMI GIS Project. Click this link to view detailed 5-part demographic-economic characteristics for this school district. See related Conroe community profile. See related Montgomery county projections to 2020. Corona-Norco Unified School District, CA gotop 2013-14 school year enrollment: 53,134 Map shows patterns of economic prosperity by neighborhood. .. ACS 2012 5-year median household income for district overall: $85,517. 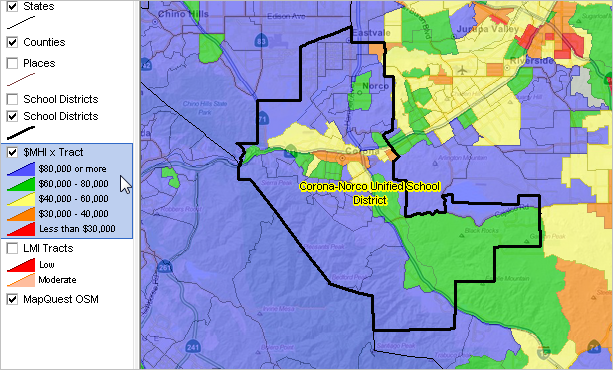 School district bold black boundary; click graphic for larger view View developed using CV XE GIS and California DMI GIS Project. Click this link to view detailed 5-part demographic-economic characteristics for this school district. See related Corona community profile. See related Riverside county projections to 2020. Cumberland County Schools, NC gotop 2013-14 school year enrollment: 53,305 Map shows patterns of economic prosperity by neighborhood. .. ACS 2012 5-year median household income for district overall: $55,961. 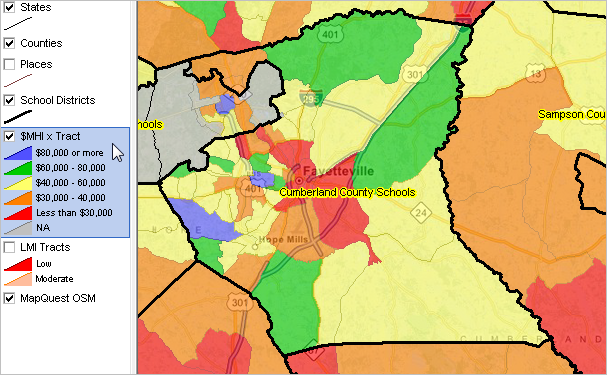 School district bold black boundary; click graphic for larger view View developed using CV XE GIS and North Carolina DMI GIS Project. Click this link to view detailed 5-part demographic-economic characteristics for this school district. See related Fayetteville community profile. See related Cumberland county projections to 2020. Cypress-Fairbanks ISD, TX gotop 2013-14 school year enrollment: 111,440 Map shows patterns of economic prosperity by neighborhood. .. ACS 2012 5-year median household income for district overall: $71,464. 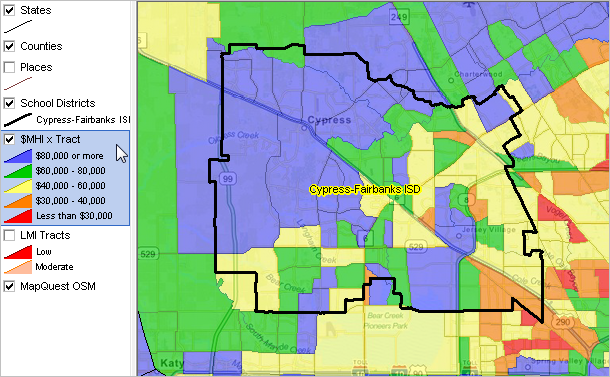 School district bold black boundary; click graphic for larger view View developed using CV XE GIS and Texas DMI GIS Project. Click this link to view detailed 5-part demographic-economic characteristics for this school district. See related Houston community profile. See related Harris county projections to 2020. Dallas ISD, TX gotop 2013-14 school year enrollment: 159,713 Map shows patterns of economic prosperity by neighborhood. .. ACS 2012 5-year median household income for district overall: $41,389. 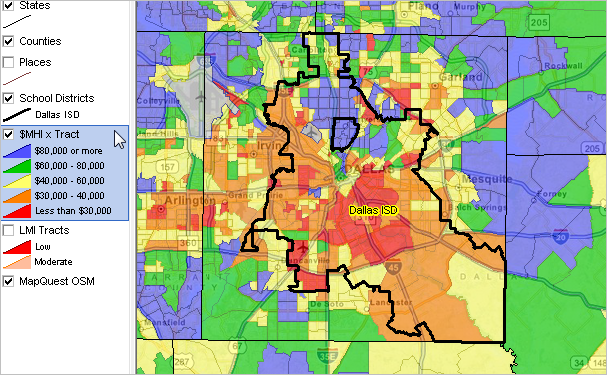 School district bold black boundary; click graphic for larger view View developed using CV XE GIS and Texas DMI GIS Project. Click this link to view detailed 5-part demographic-economic characteristics for this school district. See related Dallas community profile. See related Dallas county projections to 2020. Metropolitan Nashville Schools, TN gotop 2013-14 school year enrollment: 78,782 Map shows patterns of economic prosperity by neighborhood. .. ACS 2012 5-year median household income for district overall: $46,676.  School district bold black boundary; click graphic for larger view View developed using CV XE GIS and Tennessee DMI GIS Project. Click this link to view detailed 5-part demographic-economic characteristics for this school district. See related Nashville community profile. See related Davidson county projections to 2020. Davis School District, UT gotop 2013-14 school year enrollment: 68,573 Map shows patterns of economic prosperity by neighborhood. .. ACS 2012 5-year median household income for district overall: $69,355.  School district bold black boundary; click graphic for larger view View developed using CV XE GIS and Utah DMI GIS Project. Click this link to view detailed 5-part demographic-economic characteristics for this school district. See related Farmington community profile. See related Davis county projections to 2020. DeKalb County School District, GA gotop 2013-14 school year enrollment: 98,115 Map shows patterns of economic prosperity by neighborhood. .. ACS 2012 5-year median household income for district overall: $50,520. 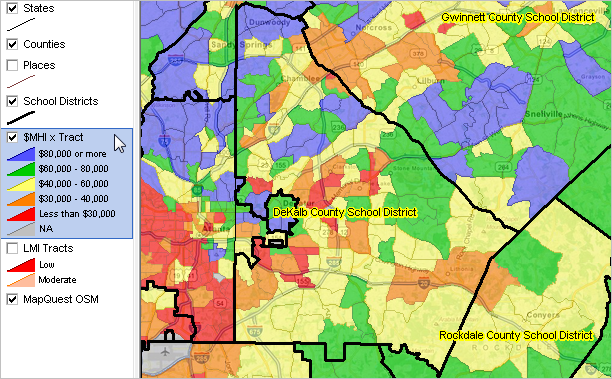 School district bold black boundary; click graphic for larger view View developed using CV XE GIS and Georgia DMI GIS Project. Click this link to view detailed 5-part demographic-economic characteristics for this school district. See related Decatur community profile. See related DeKalb county projections to 2020. Denver Public Schools, CO gotop 2013-14 school year enrollment: 86,043 Map shows patterns of economic prosperity by neighborhood. .. ACS 2012 5-year median household income for district overall: $49,091.  School district bold black boundary; click graphic for larger view View developed using CV XE GIS and Colorado DMI GIS Project. Click this link to view detailed 5-part demographic-economic characteristics for this school district. See related Denver community profile. See related Denver county projections to 2020. Detroit City School District, MI gotop 2013-14 school year enrollment: 48,730 Map shows patterns of economic prosperity by neighborhood. .. ACS 2012 5-year median household income for district overall: $26,956. 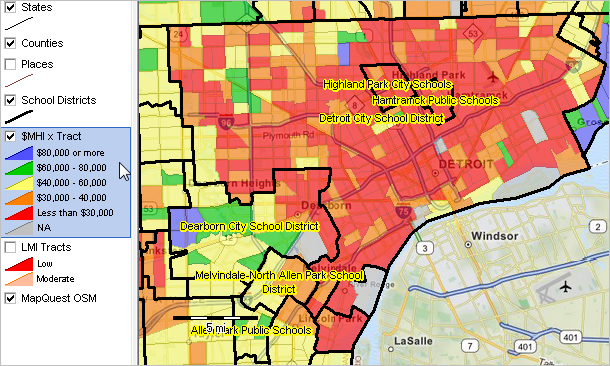 School district bold black boundary; click graphic for larger view View developed using CV XE GIS and Michigan DMI GIS Project. Click this link to view detailed 5-part demographic-economic characteristics for this school district. See related Detroit community profile. See related Wayne county projections to 2020. District of Columbia, DC gotop 2013-14 school year enrollment: Map shows patterns of economic prosperity by neighborhood. .. ACS 2012 5-year median household income for district overall: $64,267. 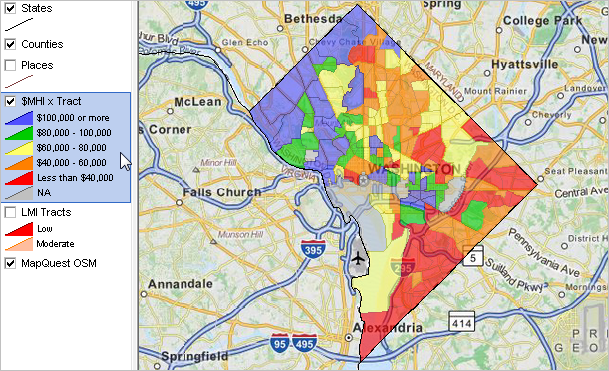 School district bold black boundary; click graphic for larger view View developed using CV XE GIS and D.C. DMI GIS Project. See related Washington, DC community profile. See related District of Columbia county projections to 2020. Douglas County School District, CO gotop 2013-14 school year enrollment: 66,230 Map shows patterns of economic prosperity by neighborhood. .. ACS 2012 5-year median household income for district overall: $101,112. 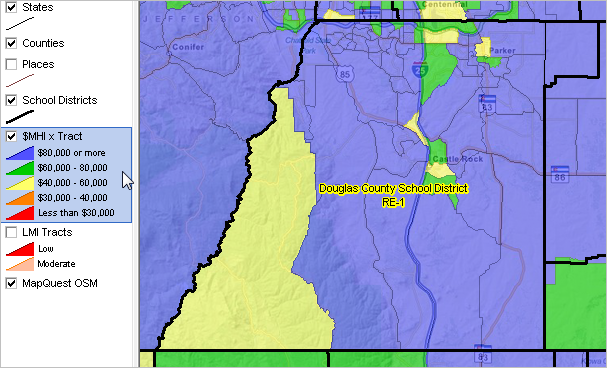 School district bold black boundary; click graphic for larger view View developed using CV XE GIS and Colorado DMI GIS Project. Click this link to view detailed 5-part demographic-economic characteristics for this school district. See related Castle Rock community profile. See related Douglas county projections to 2020. Duval County Public Schools, FL gotop 2013-14 school year enrollment: 127,559 Map shows patterns of economic prosperity by neighborhood. .. ACS 2012 5-year median household income for district overall: $48,906. 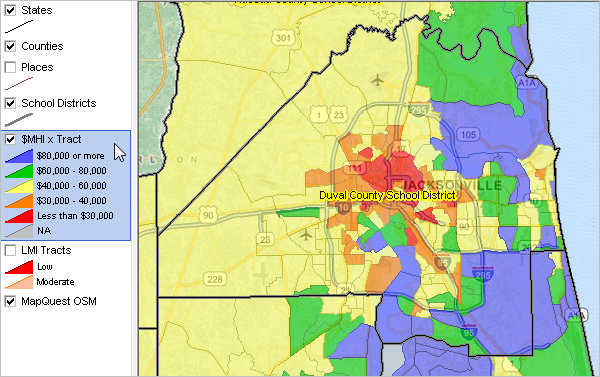 School district bold black boundary; click graphic for larger view View developed using CV XE GIS and Florida DMI GIS Project. Click this link to view detailed 5-part demographic-economic characteristics for this school district. See related Jacksonville community profile. See related Duval county projections to 2020. El Paso ISD, TX gotop 2013-14 school year enrollment: 61,620 Map shows patterns of economic prosperity by neighborhood. .. ACS 2012 5-year median household income for district overall: $39,127. 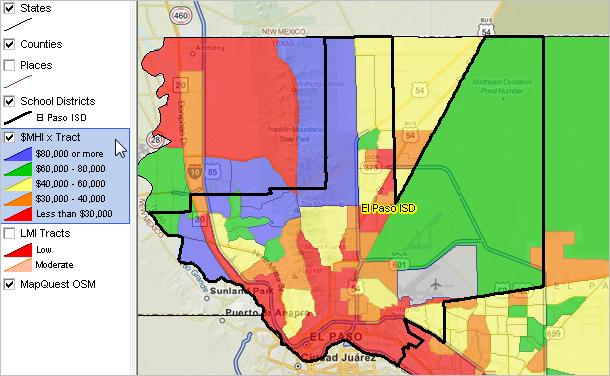 School district bold black boundary; click graphic for larger view View developed using CV XE GIS and Texas DMI GIS Project. Click this link to view detailed 5-part demographic-economic characteristics for this school district. See related El Paso community profile. See related El Paso county projections to 2020. Elk Grove Unified School District, CA gotop 2013-14 school year enrollment: 61,742 Map shows patterns of economic prosperity by neighborhood. .. ACS 2012 5-year median household income for district overall: $65,979. 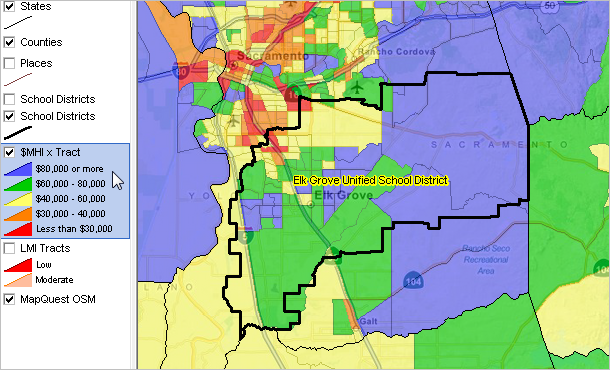 School district bold black boundary; click graphic for larger view View developed using CV XE GIS and California DMI GIS Project. Click this link to view detailed 5-part demographic-economic characteristics for this school district. See related Elk Grove community profile. See related Sacramento county projections to 2020. Fairfax County Public Schools, VA gotop 2013-14 school year enrollment: 183,417 Map shows patterns of economic prosperity by neighborhood. .. ACS 2012 5-year median household income for district overall: $109,383. 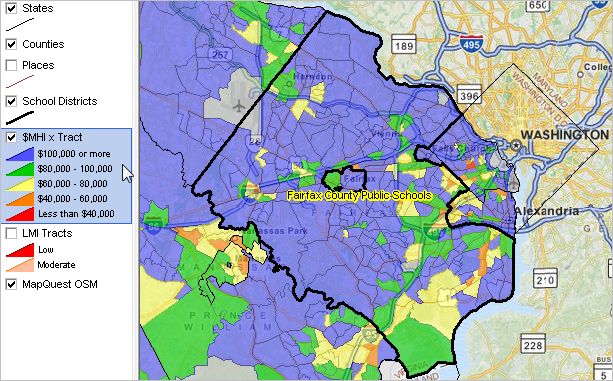 School district bold black boundary; click graphic for larger view View developed using CV XE GIS and Virginia DMI GIS Project. Click this link to view detailed 5-part demographic-economic characteristics for this school district. See related Fairfax City community profile. See related Fairfax county projections to 2020. Forsyth County/Winston-Salem Schools, NC gotop 2013-14 school year enrollment: 54,149 Map shows patterns of economic prosperity by neighborhood. .. ACS 2012 5-year median household income for district overall: $45,809. 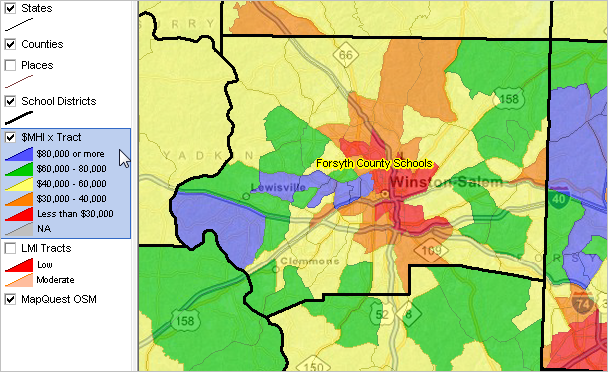 School district bold black boundary; click graphic for larger view View developed using CV XE GIS and North Carolina DMI GIS Project. Click this link to view detailed 5-part demographic-economic characteristics for this school district. See related Winston-Salem community profile. See related Forsyth county projections to 2020. Fort Bend ISD, TX gotop 2013-14 school year enrollment: 70,931 Map shows patterns of economic prosperity by neighborhood. .. ACS 2012 5-year median household income for district overall: $81,144.  School district bold black boundary; click graphic for larger view View developed using CV XE GIS and Texas DMI GIS Project. Click this link to view detailed 5-part demographic-economic characteristics for this school district. See related Sugar Land community profile. See related Fort Bend county projections to 2020. Fort Worth ISD, TX gotop 2013-14 school year enrollment: 84,588 Map shows patterns of economic prosperity by neighborhood. .. ACS 2012 5-year median household income for district overall: $40,717. 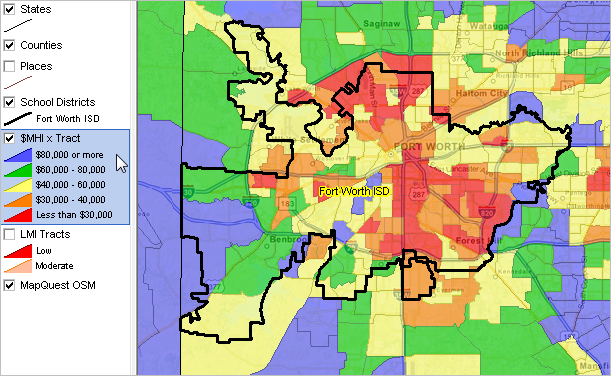 School district bold black boundary; click graphic for larger view View developed using CV XE GIS and Texas DMI GIS Project. Click this link to view detailed 5-part demographic-economic characteristics for this school district. See related Fort Worth community profile. See related Denton county projections to 2020. Fresno Unified School District, CA gotop 2013-14 school year enrollment: 71,190 Map shows patterns of economic prosperity by neighborhood. .. ACS 2012 5-year median household income for district overall: $35,957. 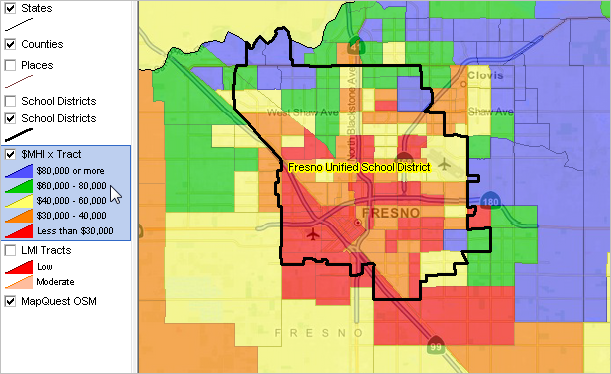 School district bold black boundary; click graphic for larger view View developed using CV XE GIS and California DMI GIS Project. Click this link to view detailed 5-part demographic-economic characteristics for this school district. See related Fresno community profile. See related Fresno county projections to 2020. Fulton County Schools, GA gotop 2013-14 school year enrollment: 91,864 Map shows patterns of economic prosperity by neighborhood. .. ACS 2012 5-year median household income for district overall: $68,238. 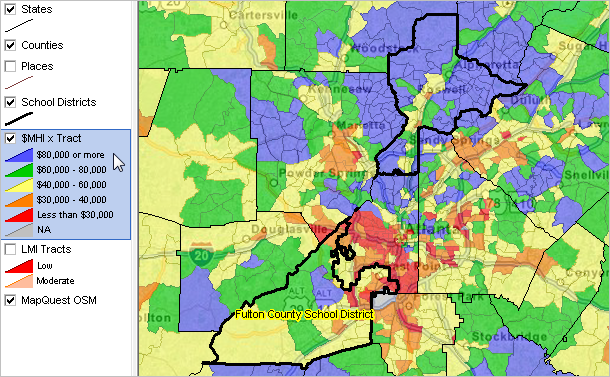 School district bold black boundary; click graphic for larger view View developed using CV XE GIS and Georgia DMI GIS Project. Click this link to view detailed 5-part demographic-economic characteristics for this school district. See related Roswell community profile. See related Fulton county projections to 2020. Garden Grove Unified School District, CA gotop 2013-14 school year enrollment: 47,960 Map shows patterns of economic prosperity by neighborhood. .. ACS 2012 5-year median household income for district overall: $59,958. 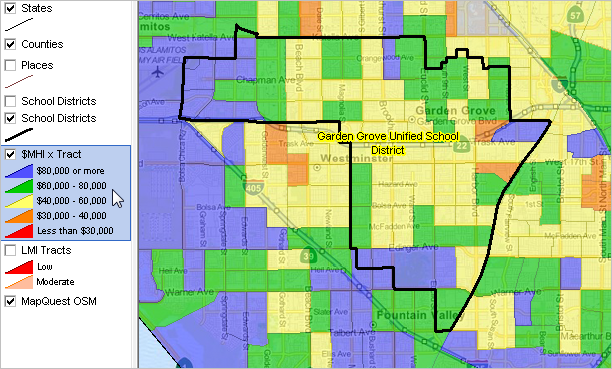 School district bold black boundary; click graphic for larger view View developed using CV XE GIS and California DMI GIS Project. Click this link to view detailed 5-part demographic-economic characteristics for this school district. See related Garden Grove community profile. See related Orange county projections to 2020. Garland ISD, TX gotop 2013-14 school year enrollment: 57,616 Map shows patterns of economic prosperity by neighborhood. .. ACS 2012 5-year median household income for district overall: $58,485. 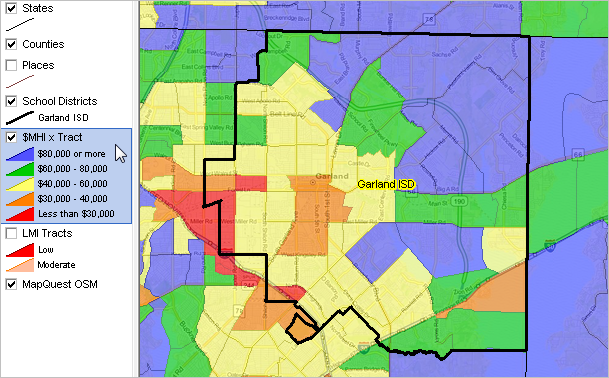 School district bold black boundary; click graphic for larger view View developed using CV XE GIS and Texas DMI GIS Project. Click this link to view detailed 5-part demographic-economic characteristics for this school district. See related Garland community profile. See related Collin county projections to 2020. Granite School District, UT gotop 2013-14 school year enrollment: 68,106 Map shows patterns of economic prosperity by neighborhood. .. ACS 2012 5-year median household income for district overall: $54,241. 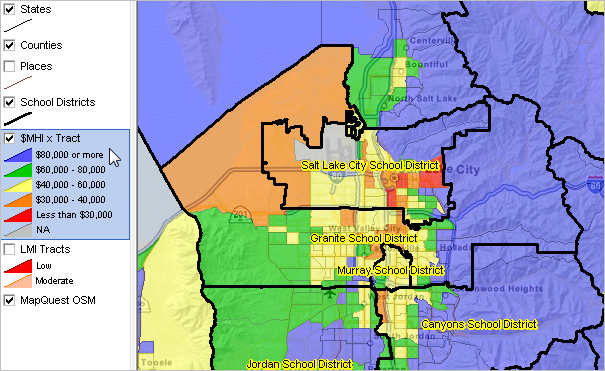 School district bold black boundary; click graphic for larger view View developed using CV XE GIS and Utah DMI GIS Project. Click this link to view detailed 5-part demographic-economic characteristics for this school district. See related West Valley community profile. See related Salt Lake county projections to 2020. Greenville County School District, SC gotop 2013-14 school year enrollment: 72,000 Map shows patterns of economic prosperity by neighborhood. .. ACS 2012 5-year median household income for district overall: $47,987.  School district bold black boundary; click graphic for larger view View developed using CV XE GIS and South Carolina DMI GIS Project. Click this link to view detailed 5-part demographic-economic characteristics for this school district. See related Greenville community profile. See related Greenville county projections to 2020. Guilford County Schools, NC gotop 2013-14 school year enrollment: 72,388 Map shows patterns of economic prosperity by neighborhood. .. ACS 2012 5-year median household income for district overall: $46,223. 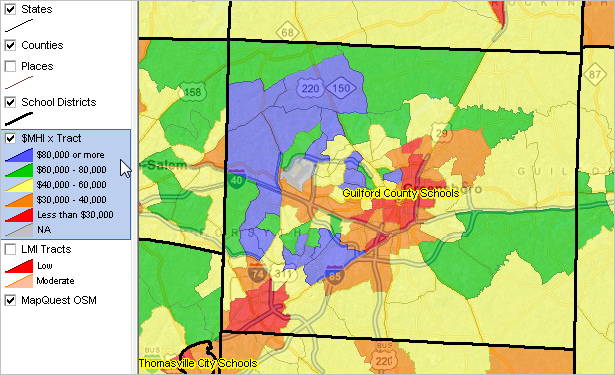 School district bold black boundary; click graphic for larger view View developed using CV XE GIS and North Carolina DMI GIS Project. Click this link to view detailed 5-part demographic-economic characteristics for this school district. See related Greensboro community profile. See related Guilford county projections to 2020. Gwinnett County Public Schools, GA gotop 2013-14 school year enrollment: 160,744 Map shows patterns of economic prosperity by neighborhood. .. ACS 2012 5-year median household income for district overall: $62,216. 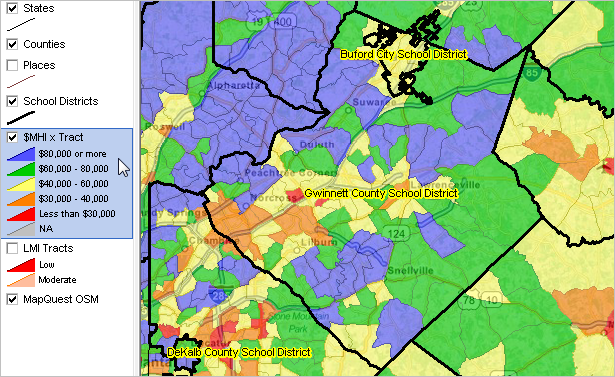 School district bold black boundary; click graphic for larger view View developed using CV XE GIS and Georgia DMI GIS Project. Click this link to view detailed 5-part demographic-economic characteristics for this school district. See related Lawrenceville community profile. See related Gwinnett county projections to 2020. Hawaii Public Schools, HI gotop 2013-14 school year enrollment: 185,273 Map shows patterns of economic prosperity by neighborhood. .. ACS 2012 5-year median household income for district overall: $67,492. 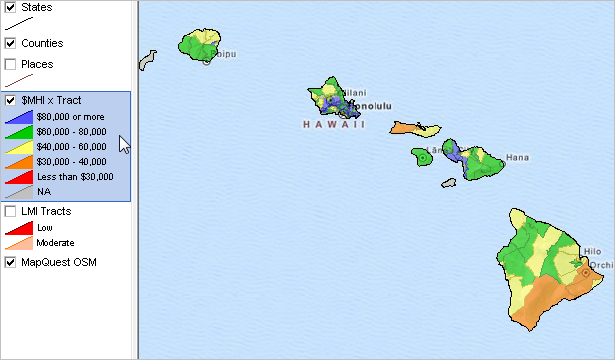 School district bold black boundary; click graphic for larger view View developed using CV XE GIS and Hawaii DMI GIS Project. Click this link to view detailed 5-part demographic-economic characteristics for this school district. See related Hilo CDP community profile. See related Hawaii county projections to 2020. Henrico County Public Schools, VA gotop 2013-14 school year enrollment: 50,569 Map shows patterns of economic prosperity by neighborhood. .. ACS 2012 5-year median household income for district overall: $61,300.  School district bold black boundary; click graphic for larger view View developed using CV XE GIS and Virginia DMI GIS Project. Click this link to view detailed 5-part demographic-economic characteristics for this school district. See related Richmond community profile. See related Henrico county projections to 2020. Hillsborough County Public Schools, FL gotop 2013-14 school year enrollment: 203,431 Map shows patterns of economic prosperity by neighborhood. .. ACS 2012 5-year median household income for district overall: $49,450.  School district bold black boundary; click graphic for larger view View developed using CV XE GIS and Florida DMI GIS Project. Click this link to view detailed 5-part demographic-economic characteristics for this school district. See related Tampa community profile. See related Hillsborough county projections to 2020. Houston ISD, TX gotop 2013-14 school year enrollment: 211,552 Map shows patterns of economic prosperity by neighborhood. .. ACS 2012 5-year median household income for district overall: $45,222. 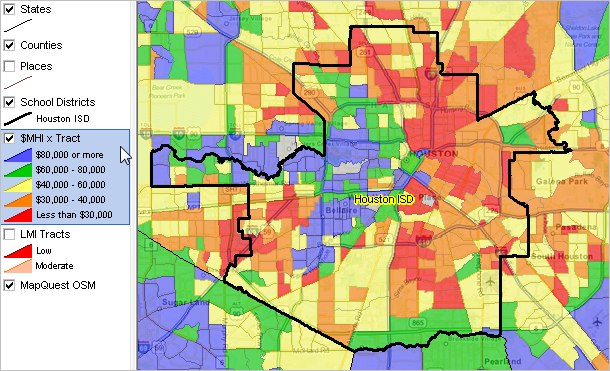 School district bold black boundary; click graphic for larger view View developed using CV XE GIS and Texas DMI GIS Project. Click this link to view detailed 5-part demographic-economic characteristics for this school district. See related Houston community profile. See related Harris county projections to 2020. Howard County Public Schools, MD gotop 2013-14 school year enrollment: 51,681 Map shows patterns of economic prosperity by neighborhood. .. ACS 2012 5-year median household income for district overall: $107,821.  School district bold black boundary; click graphic for larger view View developed using CV XE GIS and Maryland DMI GIS Project. Click this link to view detailed 5-part demographic-economic characteristics for this school district. See related Columbia community profile. See related Howard county projections to 2020. Jeffco Public Schools, CO gotop 2013-14 school year enrollment: 85,983 Map shows patterns of economic prosperity by neighborhood. .. ACS 2012 5-year median household income for district overall: $68,741. 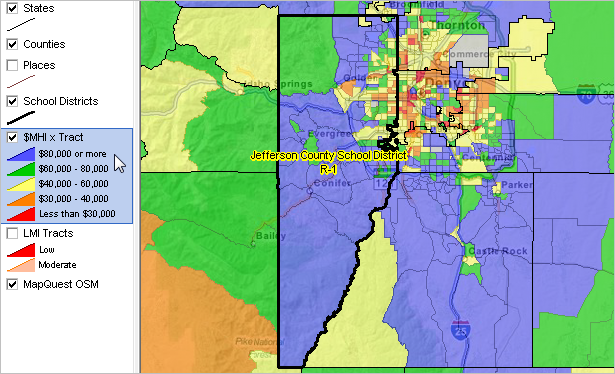 School district bold black boundary; click graphic for larger view View developed using CV XE GIS and Colorado DMI GIS Project. Click this link to view detailed 5-part demographic-economic characteristics for this school district. See related Golden community profile. See related Jefferson county projections to 2020. Jefferson County Schools, KY gotop 2013-14 school year enrollment: 100,975 Map shows patterns of economic prosperity by neighborhood. .. ACS 2012 5-year median household income for district overall: $46,591. 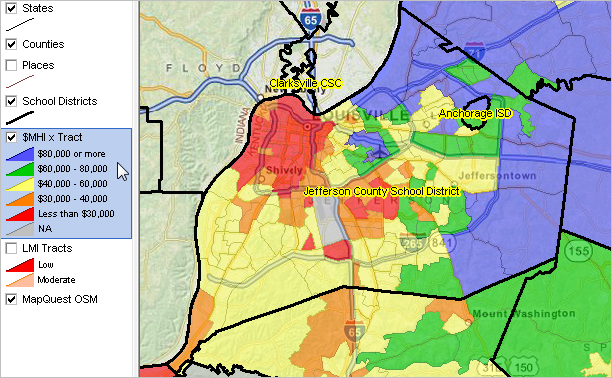 School district bold black boundary; click graphic for larger view View developed using CV XE GIS and Kentucky DMI GIS Project. Click this link to view detailed 5-part demographic-economic characteristics for this school district. See related Louisville community profile. Jefferson Parish Schools, LA gotop 2013-14 school year enrollment: 47,564 Map shows patterns of economic prosperity by neighborhood. .. ACS 2012 5-year median household income for district overall: $48,522.  School district bold black boundary; click graphic for larger view View developed using CV XE GIS and Louisiana DMI GIS Project. See related New Orleans community profile. See related Jefferson Parish projections to 2020. Jordan School District, UT gotop 2013-14 school year enrollment: 52,855 Map shows patterns of economic prosperity by neighborhood. .. ACS 2012 5-year median household income for district overall: $75,579. 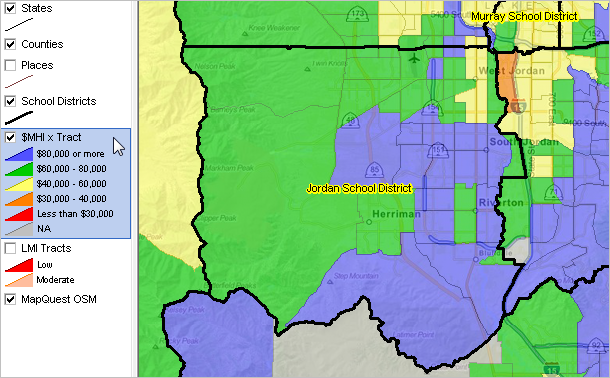 School district bold black boundary; click graphic for larger view View developed using CV XE GIS and Utah DMI GIS Project. Click this link to view detailed 5-part demographic-economic characteristics for this school district. See related West Jordan community profile. See related Salt Lake County county projections to 2020. Katy ISD, TX gotop 2013-14 school year enrollment: 67,213 Map shows patterns of economic prosperity by neighborhood. .. ACS 2012 5-year median household income for district overall: $87,829. 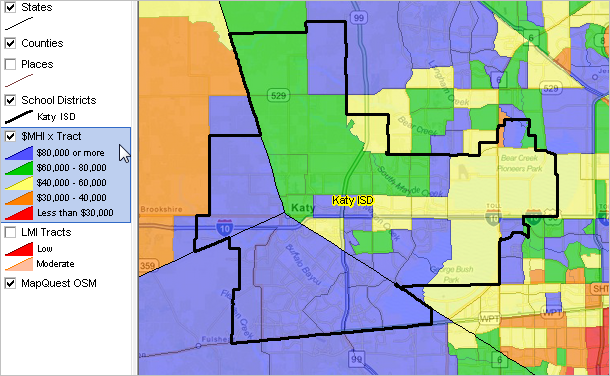 School district bold black boundary; click graphic for larger view View developed using CV XE GIS and Texas DMI GIS Project. Click this link to view detailed 5-part demographic-economic characteristics for this school district. See related Katy community profile. See related Fort Bend county projections to 2020. Klein ISD, TX gotop 2013-14 school year enrollment: 48,253 Map shows patterns of economic prosperity by neighborhood. .. ACS 2012 5-year median household income for district overall: $ 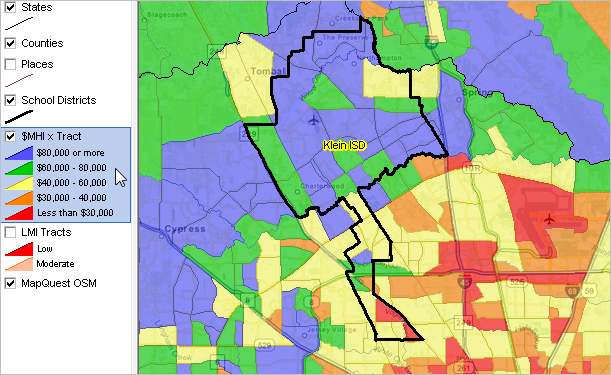 School district bold black boundary; click graphic for larger view View developed using CV XE GIS and Texas DMI GIS Project. Click this link to view detailed 5-part demographic-economic characteristics for this school district. See related Spring CDP community profile. See related Harris county projections to 2020. Knox County Schools, TN gotop 2013-14 school year enrollment: 57,847 Map shows patterns of economic prosperity by neighborhood. .. ACS 2012 5-year median household income for district overall: $47,270. 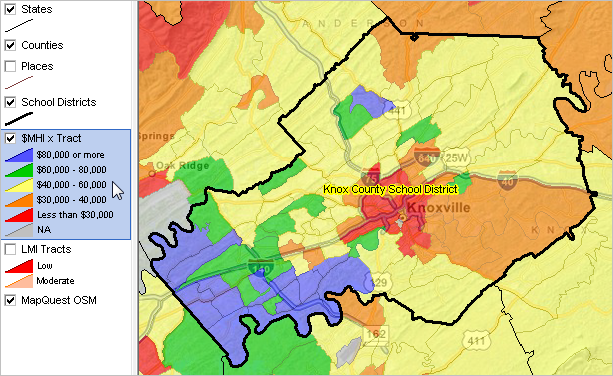 School district bold black boundary; click graphic for larger view View developed using CV XE GIS and Tennessee DMI GIS Project. Click this link to view detailed 5-part demographic-economic characteristics for this school district. See related Knoxville community profile. See related Knox county projections to 2020. Lee County Public Schools, FL gotop 2013-14 school year enrollment: 87,422 Map shows patterns of economic prosperity by neighborhood. .. ACS 2012 5-year median household income for district overall: $48,453. 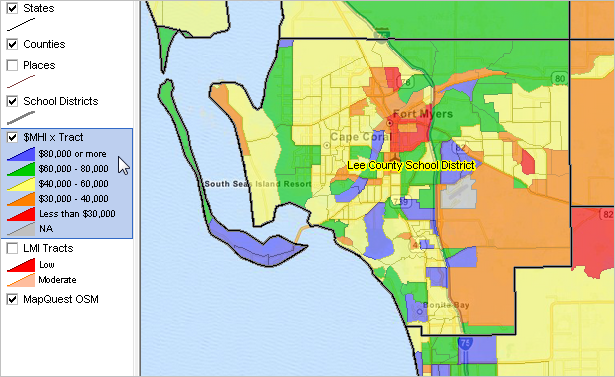 School district bold black boundary; click graphic for larger view View developed using CV XE GIS and Florida DMI GIS Project. Click this link to view detailed 5-part demographic-economic characteristics for this school district. See related Fort Myers community profile. See related Lee county projections to 2020. Lewisville ISD, TX gotop 2013-14 school year enrollment: 52,801 Map shows patterns of economic prosperity by neighborhood. .. ACS 2012 5-year median household income for district overall: $81,912. 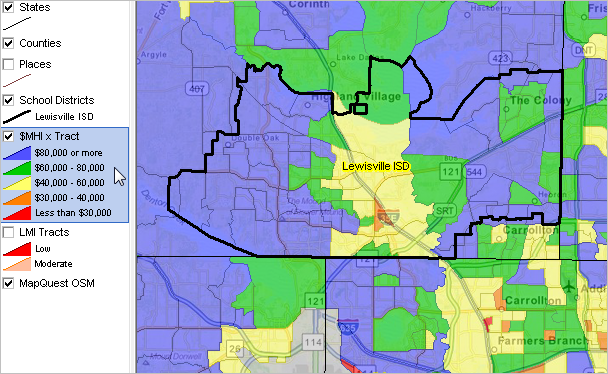 School district bold black boundary; click graphic for larger view View developed using CV XE GIS and Texas DMI GIS Project. Click this link to view detailed 5-part demographic-economic characteristics for this school district. See related Lewisville community profile. See related Dallas county projections to 2020. Long Beach Unified School District, CA gotop 2013-14 school year enrollment: 80,405 Map shows patterns of economic prosperity by neighborhood. .. ACS 2012 5-year median household income for district overall: $55,287. 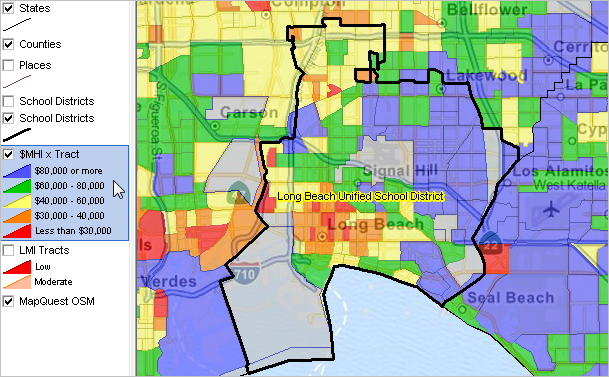 School district bold black boundary; click graphic for larger view View developed using CV XE GIS and California DMI GIS Project. Click this link to view detailed 5-part demographic-economic characteristics for this school district. See related Long Beach community profile. See related Los Angeles county projections to 2020. Los Angeles Unified School District, CA gotop 2013-14 school year enrollment: 651,322 Map shows patterns of economic prosperity by neighborhood. .. ACS 2012 5-year median household income for district overall: $49,322. 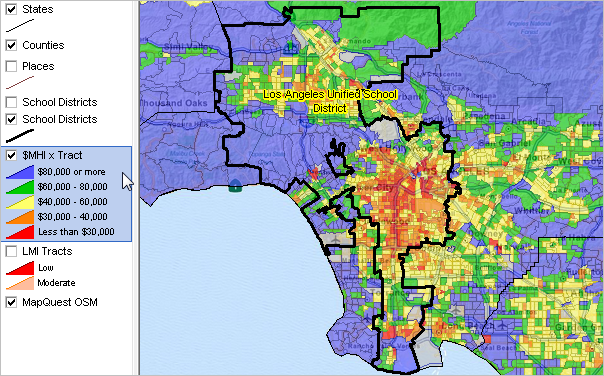 School district bold black boundary; click graphic for larger view View developed using CV XE GIS and California DMI GIS Project. Click this link to view detailed 5-part demographic-economic characteristics for this school district. See related Los Angeles community profile. See related Los Angeles county projections to 2020. Loudoun County Schools, VA gotop 2013-14 school year enrollment: 70,759 Map shows patterns of economic prosperity by neighborhood. .. ACS 2012 5-year median household income for district overall: $122,068. 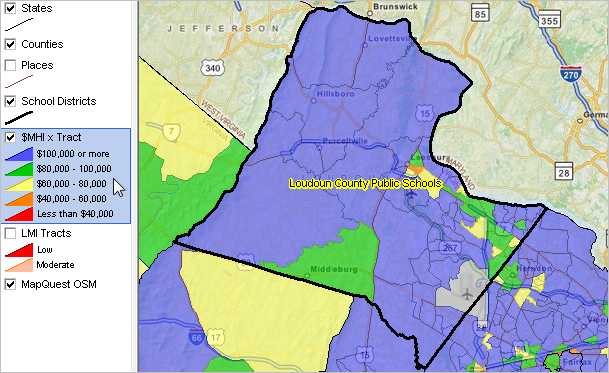 School district bold black boundary; click graphic for larger view View developed using CV XE GIS and Virginia DMI GIS Project. Click this link to view detailed 5-part demographic-economic characteristics for this school district. See related Loudoun county projections to 2020. Memphis City Schools, TN gotop 2013-14 school year enrollment: 113,500 Map shows patterns of economic prosperity by neighborhood. .. ACS 2012 5-year median household income for district overall: $32,228. 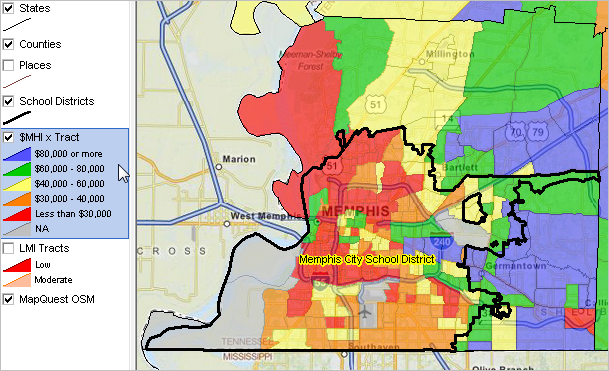 School district bold black boundary; click graphic for larger view View developed using CV XE GIS and Tennessee DMI GIS Project. Click this link to view detailed 5-part demographic-economic characteristics for this school district. See related Memphis community profile. See related Shelby county projections to 2020. Mesa Public Schools, AZ gotop 2013-14 school year enrollment: 63,597 Map shows patterns of economic prosperity by neighborhood. .. ACS 2012 5-year median household income for district overall: $46,272.  School district bold black boundary; click graphic for larger view View developed using CV XE GIS and Arizona DMI GIS Project. Click this link to view detailed 5-part demographic-economic characteristics for this school district. See related Mesa community profile. See related Maricopa county projections to 2020. Miami-Dade County Public Schools, FL gotop 2013-14 school year enrollment: 356,241 Map shows patterns of economic prosperity by neighborhood. .. ACS 2012 5-year median household income for district overall: $43,464. 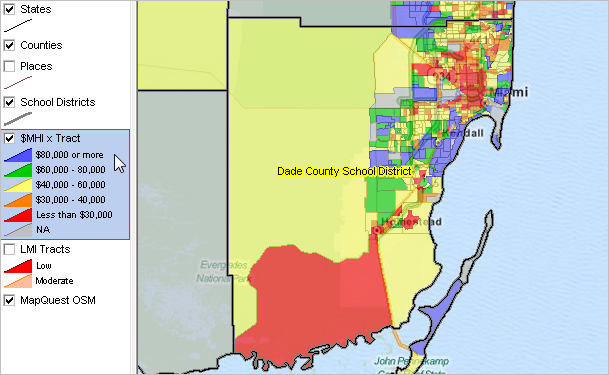 School district bold black boundary; click graphic for larger view View developed using CV XE GIS and Florida DMI GIS Project. Click this link to view detailed 5-part demographic-economic characteristics for this school district. See related Miami community profile. See related Miami-Dade county projections to 2020. Milwaukee School District, WI gotop 2013-14 school year enrollment: 78,516 Map shows patterns of economic prosperity by neighborhood. .. ACS 2012 5-year median household income for district overall: $35,837. 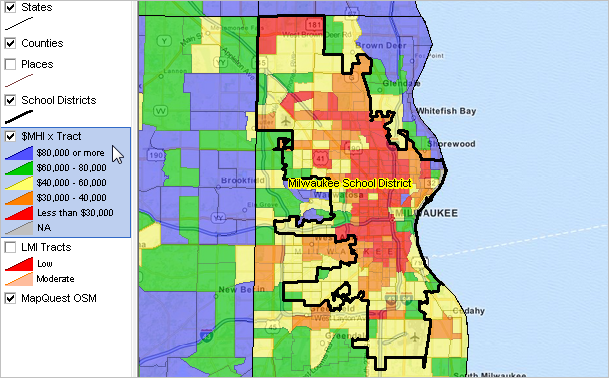 School district bold black boundary; click graphic for larger view View developed using CV XE GIS and Wisconsin DMI GIS Project. See related Milwaukee community profile. See related Milwaukee county projections to 2020. Mobile County Public Schools, AL gotop 2013-14 school year enrollment: 59,550 Map shows patterns of economic prosperity by neighborhood. .. ACS 2012 5-year median household income for district overall: $42,740. 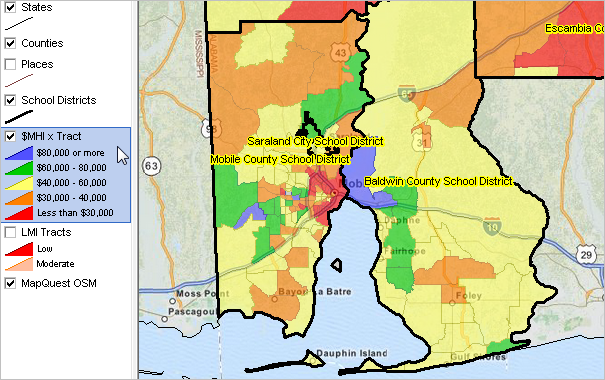 School district bold black boundary; click graphic for larger view View developed using CV XE GIS and Alabama DMI GIS Project. See related Mobile community profile. See related Mobile county projections to 2020. Montgomery County Public Schools, MD gotop 2013-14 school year enrollment: 151,289 Map shows patterns of economic prosperity by neighborhood. .. ACS 2012 5-year median household income for district overall: $96,985. 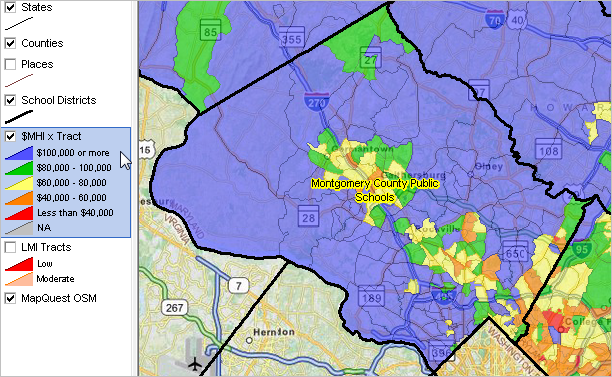 School district bold black boundary; click graphic for larger view View developed using CV XE GIS and Maryland DMI GIS Project. Click this link to view detailed 5-part demographic-economic characteristics for this school district. See related Rockville community profile. See related Montgomery county projections to 2020. New York City Public Schools, NY gotop 2013-14 school year enrollment: 955,028 Map shows patterns of economic prosperity by neighborhood. .. ACS 2012 5-year median household income for district overall: $51,865.  School district bold black boundary; click graphic for larger view View developed using CV XE GIS and New York DMI GIS Project. Click this link to view detailed 5-part demographic-economic characteristics for this school district. See related New York community profile. See related New York county projections to 2020. North East ISD, TX gotop 2013-14 school year enrollment: 68,205 Map shows patterns of economic prosperity by neighborhood. .. ACS 2012 5-year median household income for district overall: $57,233. 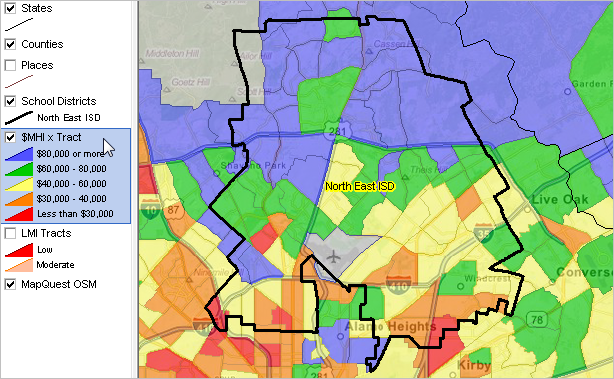 School district bold black boundary; click graphic for larger view View developed using CV XE GIS and Texas DMI GIS Project. Click this link to view detailed 5-part demographic-economic characteristics for this school district. See related San Antonio community profile. See related Bexar county projections to 2020. Northside ISD, TX gotop 2013-14 school year enrollment: 102,129 Map shows patterns of economic prosperity by neighborhood. .. ACS 2012 5-year median household income for district overall: $57,455.  School district bold black boundary; click graphic for larger view View developed using CV XE GIS and Texas DMI GIS Project. Click this link to view detailed 5-part demographic-economic characteristics for this school district. See related San Antonio community profile. See related Bexar county projections to 2020. Oakland Schools, CA gotop 2013-14 school year enrollment: 37,040 Map shows patterns of economic prosperity by neighborhood. .. ACS 2012 5-year median household income for district overall: $51,661. 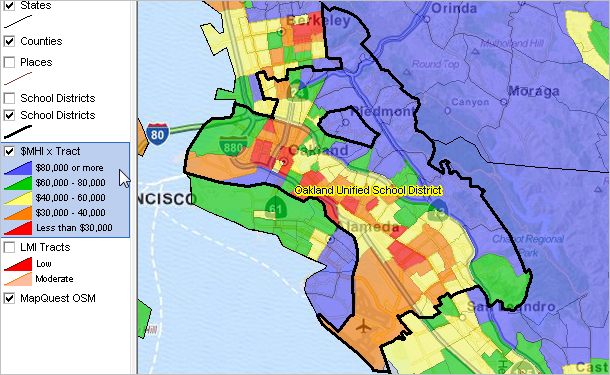 School district bold black boundary; click graphic for larger view View developed using CV XE GIS and California DMI GIS Project. Click this link to view detailed 5-part demographic-economic characteristics for this school district. See related Oakland community profile. See related Alameda county projections to 2020. Omaha Public Schools, NE gotop 2013-14 school year enrollment: 49,405 Map shows patterns of economic prosperity by neighborhood. .. ACS 2012 5-year median household income for district overall: $44,947. 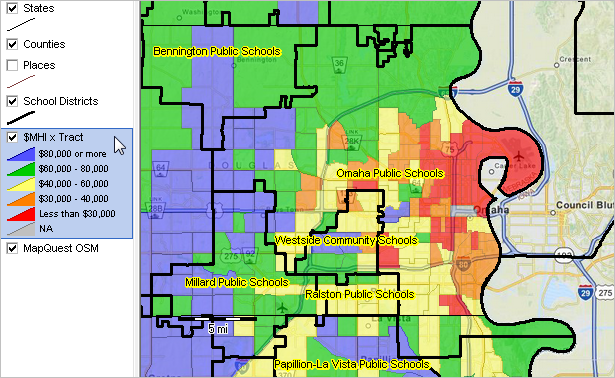 School district bold black boundary; click graphic for larger view View developed using CV XE GIS and Nebraska DMI GIS Project. See related Omaha community profile. See related Douglas county projections to 2020. Orange County Public Schools, FL gotop 2013-14 school year enrollment: 187,092 Map shows patterns of economic prosperity by neighborhood. .. ACS 2012 5-year median household income for district overall: $48,429.  School district bold black boundary; click graphic for larger view View developed using CV XE GIS and Florida DMI GIS Project. Click this link to view detailed 5-part demographic-economic characteristics for this school district. See related Orlando community profile. See related Orange county projections to 2020. Osceola County Public Schools, FL gotop 2013-14 school year enrollment: 58,147 Map shows patterns of economic prosperity by neighborhood. .. ACS 2012 5-year median household income for district overall: $44,887. 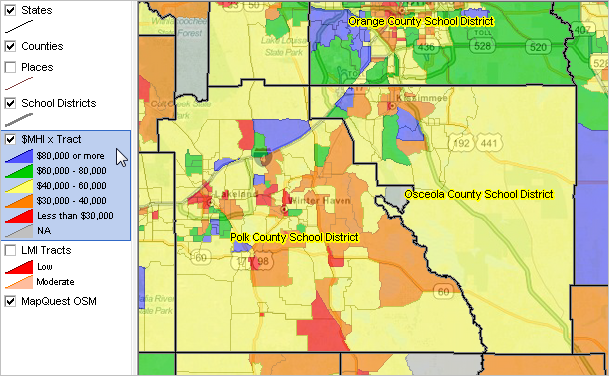 School district bold black boundary; click graphic for larger view View developed using CV XE GIS and Florida DMI GIS Project. Click this link to view detailed 5-part demographic-economic characteristics for this school district. See related Kissimmee community profile. See related Osceola county projections to 2020. Palm Beach County School District, FL gotop 2013-14 school year enrollment: 182,889 Map shows patterns of economic prosperity by neighborhood. .. ACS 2012 5-year median household income for district overall: $52,806.  School district bold black boundary; click graphic for larger view View developed using CV XE GIS and Florida DMI GIS Project. Click this link to view detailed 5-part demographic-economic characteristics for this school district. See related Palm Beach community profile. See related Palm Beach county projections to 2020. Pasadena ISD, TX gotop 2013-14 school year enrollment: 54,535 Map shows patterns of economic prosperity by neighborhood. .. ACS 2012 5-year median household income for district overall: $44,400.  School district bold black boundary; click graphic for larger view View developed using CV XE GIS and Texas DMI GIS Project. Click this link to view detailed 5-part demographic-economic characteristics for this school district. See related Pasadena community profile. See related Harris county projections to 2020. Pasco County Public Schools, FL gotop 2013-14 school year enrollment: 68,107 Map shows patterns of economic prosperity by neighborhood. .. ACS 2012 5-year median household income for district overall: $43,787. 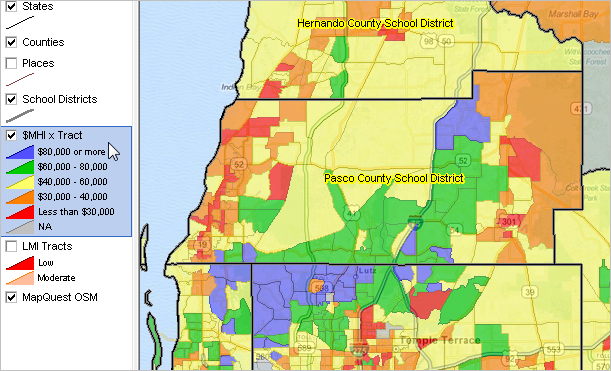 School district bold black boundary; click graphic for larger view View developed using CV XE GIS and Florida DMI GIS Project. Click this link to view detailed 5-part demographic-economic characteristics for this school district. See related Land O Lakes community profile. See related Pasco county projections to 2020. Philadelphia City Schools, PA gotop 2013-14 school year enrollment: 131,362 Map shows patterns of economic prosperity by neighborhood. .. ACS 2012 5-year median household income for district overall: $37,016.  School district bold black boundary; click graphic for larger view View developed using CV XE GIS and Pennsylvania DMI GIS Project. Click this link to view detailed 5-part demographic-economic characteristics for this school district. See related Philadelphia community profile. See related Philadelphia county projections to 2020. Pinellas County Public Schools, FL gotop 2013-14 school year enrollment: 103,391 Map shows patterns of economic prosperity by neighborhood. .. ACS 2012 5-year median household income for district overall: $46,051.  School district bold black boundary; click graphic for larger view View developed using CV XE GIS and Florida DMI GIS Project. Click this link to view detailed 5-part demographic-economic characteristics for this school district. See related Land O Lakes community profile. See related Pasco county projections to 2020. Plano ISD, TX gotop 2013-14 school year enrollment: 54,822 Map shows patterns of economic prosperity by neighborhood. .. ACS 2012 5-year median household income for district overall: $80,276. 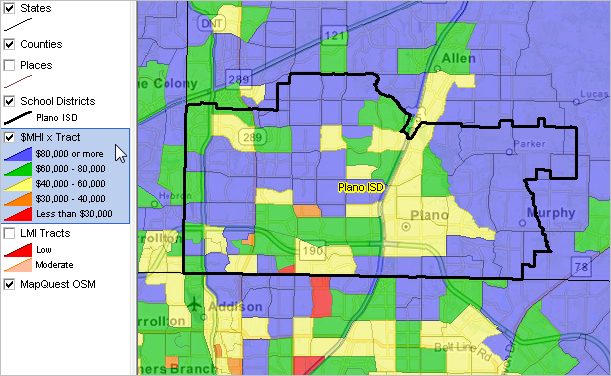 School district bold black boundary; click graphic for larger view View developed using CV XE GIS and Texas DMI GIS Project. Click this link to view detailed 5-part demographic-economic characteristics for this school district. See related Winter Haven community profile. See related Polk county projections to 2020. Polk County Public Schools, FL gotop 2013-14 school year enrollment: 97,971 Map shows patterns of economic prosperity by neighborhood. .. ACS 2012 5-year median household income for district overall: $43,606.  School district bold black boundary; click graphic for larger view View developed using CV XE GIS and Florida DMI GIS Project. Click this link to view detailed 5-part demographic-economic characteristics for this school district. See related Plano community profile. See related Collin county projections to 2020. Prince Georges County Public Schools, MD gotop 2013-14 school year enrollment: 125,136 Map shows patterns of economic prosperity by neighborhood. .. ACS 2012 5-year median household income for district overall: $73,568. 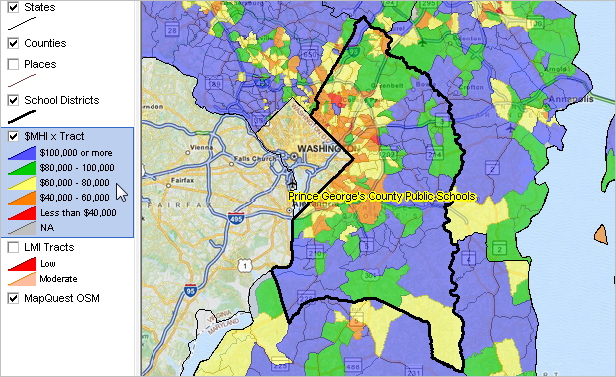 School district bold black boundary; click graphic for larger view View developed using CV XE GIS and Maryland DMI GIS Project. Click this link to view detailed 5-part demographic-economic characteristics for this school district. See related Greenbelt community profile. See related Prince Georges county projections to 2020. Prince William County, VA gotop 2013-14 school year enrollment: 85,451 Map shows patterns of economic prosperity by neighborhood. .. ACS 2012 5-year median household income for district overall: $73,568.  School district bold black boundary; click graphic for larger view View developed using CV XE GIS and Virginia DMI GIS Project. Click this link to view detailed 5-part demographic-economic characteristics for this school district. See related Prince William county projections to 2020. Round Rock ISD, TX gotop 2013-14 school year enrollment: 46,666 Map shows patterns of economic prosperity by neighborhood. .. ACS 2012 5-year median household income for district overall: $  School district bold black boundary; click graphic for larger view View developed using CV XE GIS and Texas DMI GIS Project. Click this link to view detailed 5-part demographic-economic characteristics for this school district. See related Round Rock community profile. See related Travis county projections to 2020. Sacramento City Unified School District, CA gotop 2013-14 school year enrollment: 43,323 Map shows patterns of economic prosperity by neighborhood. .. ACS 2012 5-year median household income for district overall: $48,301. 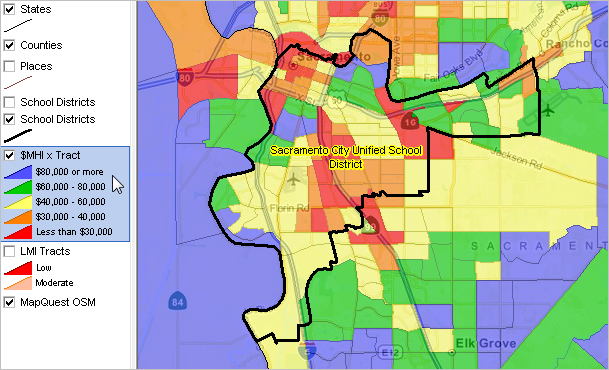 School district bold black boundary; click graphic for larger view View developed using CV XE GIS and California DMI GIS Project. Click this link to view detailed 5-part demographic-economic characteristics for this school district. See related Sacramento community profile. See related Sacramento county projections to 2020. San Antonio ISD, TX gotop 2013-14 school year enrollment: 53,857 Map shows patterns of economic prosperity by neighborhood. .. ACS 2012 5-year median household income for district overall: $30,577. 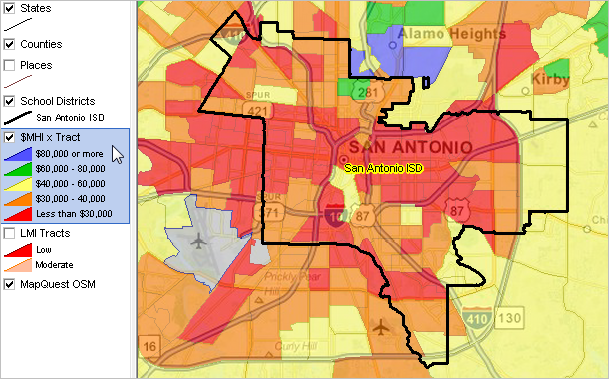 School district bold black boundary; click graphic for larger view View developed using CV XE GIS and Texas DMI GIS Project. Click this link to view detailed 5-part demographic-economic characteristics for this school district. See related San Antonio community profile. See related Bexar county projections to 2020. San Bernardino City Unified, CA gotop 2013-14 school year enrollment: 49,959 Map shows patterns of economic prosperity by neighborhood. .. ACS 2012 5-year median household income for district overall: $39,551. 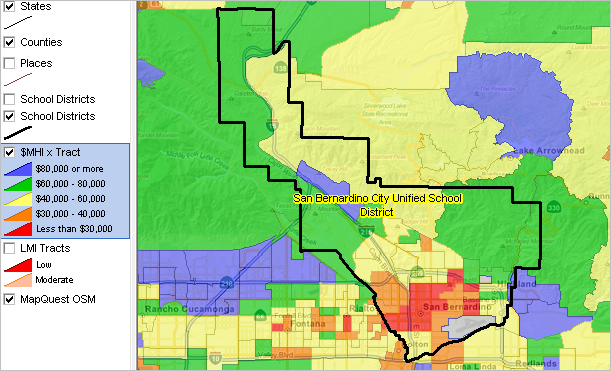 School district bold black boundary; click graphic for larger view View developed using CV XE GIS and California DMI GIS Project. Click this link to view detailed 5-part demographic-economic characteristics for this school district. See related San Bernardino community profile. See related San Bernardino county projections to 2020. San Diego Unified School District, CA gotop 2013-14 school year enrollment: 130,041 Map shows patterns of economic prosperity by neighborhood. .. ACS 2012 5-year median household income for district overall: $59,835.  School district bold black boundary; click graphic for larger view View developed using CV XE GIS and California DMI GIS Project. Click this link to view detailed 5-part demographic-economic characteristics for this school district. See related San Diego community profile. See related San Diego county projections to 2020. San Francisco Unified School District, CA gotop 2013-14 school year enrollment: 53,000 Map shows patterns of economic prosperity by neighborhood. .. ACS 2012 5-year median household income for district overall: $73,802. 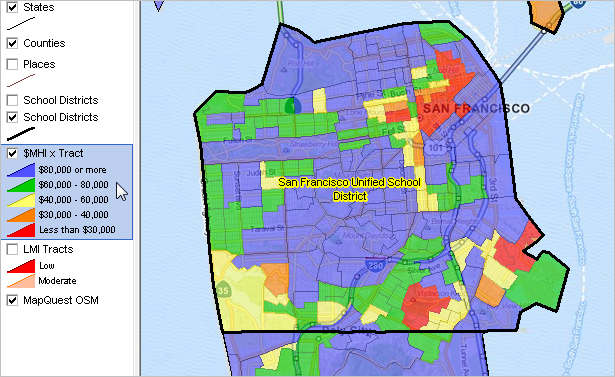 School district bold black boundary; click graphic for larger view View developed using CV XE GIS and California DMI GIS Project. Click this link to view detailed 5-part demographic-economic characteristics for this school district. See related San Francisco community profile. See related San Francisco county projections to 2020. Santa Ana Unified School District, CA gotop 2013-14 school year enrollment: 53,371 Map shows patterns of economic prosperity by neighborhood. .. ACS 2012 5-year median household income for district overall: $55,801. 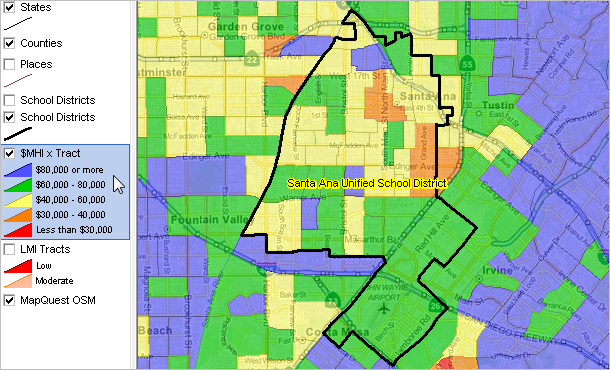 School district bold black boundary; click graphic for larger view View developed using CV XE GIS and California DMI GIS Project. Click this link to view detailed 5-part demographic-economic characteristics for this school district. See related Santa Ana community profile. See related Orange county projections to 2020. Seattle Public Schools, WA gotop 2013-14 school year enrollment: 51,010 Map shows patterns of economic prosperity by neighborhood. .. ACS 2012 5-year median household income for district overall: $63,445. 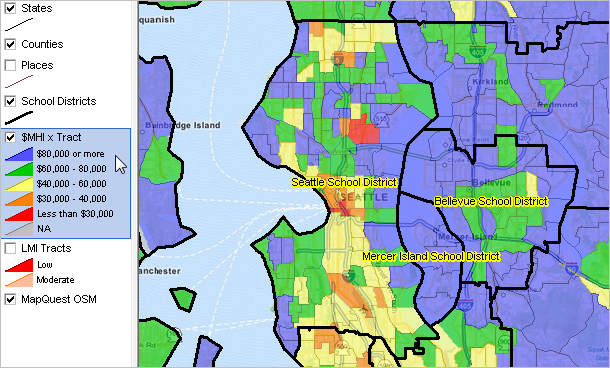 School district bold black boundary; click graphic for larger view View developed using CV XE GIS and Washington DMI GIS Project. Click this link to view detailed 5-part demographic-economic characteristics for this school district. See related Seattle community profile. See related King county projections to 2020. Seminole County Public Schools, FL gotop 2013-14 school year enrollment: 64,831 Map shows patterns of economic prosperity by neighborhood. .. ACS 2012 5-year median household income for district overall: $58,577. 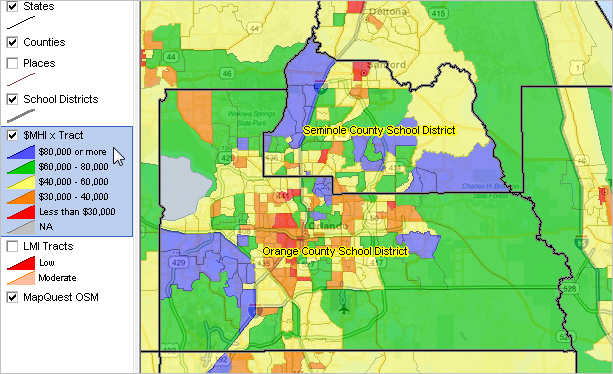 School district bold black boundary; click graphic for larger view View developed using CV XE GIS and Florida DMI GIS Project. Click this link to view detailed 5-part demographic-economic characteristics for this school district. See related Seminole community profile. See related Sanford community profile. See related Seminole county projections to 2020. Shelby County Schools, TN gotop 2013-14 school year enrollment: 45,690 Map shows patterns of economic prosperity by neighborhood. .. ACS 2012 5-year median household income for district overall: $77,389. 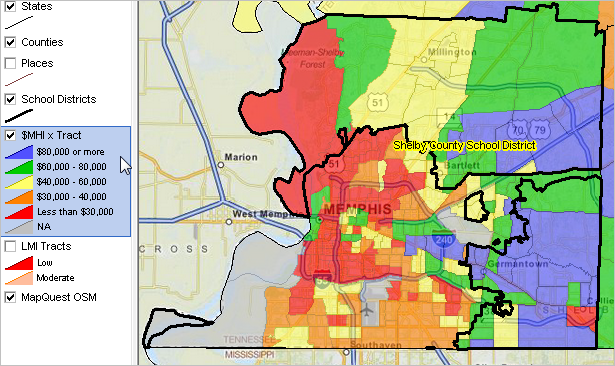 School district bold black boundary; click graphic for larger view View developed using CV XE GIS and Tennessee DMI GIS Project. Click this link to view detailed 5-part demographic-economic characteristics for this school district. See related Germantown community profile. See related Shelby county projections to 2020. Tucson Unified District, AZ gotop 2013-14 school year enrollment: 48,975 Map shows patterns of economic prosperity by neighborhood. .. ACS 2012 5-year median household income for district overall: $40,767. 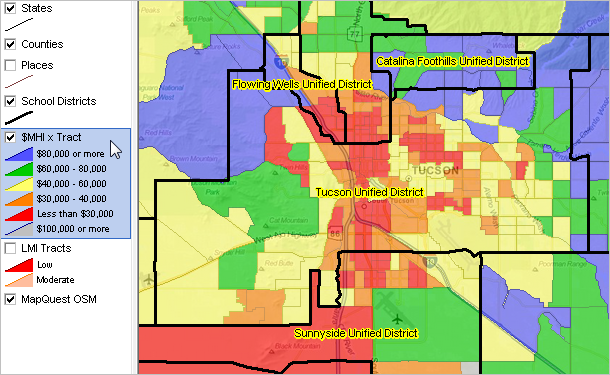 School district bold black boundary; click graphic for larger view View developed using CV XE GIS and Arizona DMI GIS Project. Click this link to view detailed 5-part demographic-economic characteristics for this school district. See related Tucson community profile. See related Pima county projections to 2020. Virginia Beach City Public Schools, VA gotop 2013-14 school year enrollment: 70,556 Map shows patterns of economic prosperity by neighborhood. .. ACS 2012 5-year median household income for district overall: $65,980.  School district bold black boundary; click graphic for larger view View developed using CV XE GIS and Virginia DMI GIS Project. Click this link to view detailed 5-part demographic-economic characteristics for this school district. See related Virginia Beach community profile. See related Virginia Beach county projections to 2020. Volusia County Public Schools, FL gotop 2013-14 school year enrollment: 61,226 Map shows patterns of economic prosperity by neighborhood. .. ACS 2012 5-year median household income for district overall: $43,419.  School district bold black boundary; click graphic for larger view View developed using CV XE GIS and Florida DMI GIS Project. Click this link to view detailed 5-part demographic-economic characteristics for this school district. See related Daytona Beach community profile. See related Daytona Beach community profile. See related Volusia county projections to 2020. Wake County Schools, NC gotop 2013-14 school year enrollment: 144,156 Map shows patterns of economic prosperity by neighborhood. .. ACS 2012 5-year median household income for district overall: $65,826. 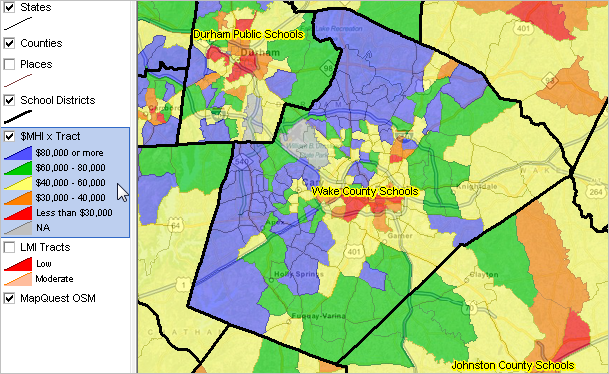 School district bold black boundary; click graphic for larger view View developed using CV XE GIS and North Carolina DMI GIS Project. Click this link to view detailed 5-part demographic-economic characteristics for this school district. See related Cary community profile. See related Wake county projections to 2020. Washoe County School District, NV gotop 2013-14 school year enrollment: 63,323 Map shows patterns of economic prosperity by neighborhood. .. ACS 2012 5-year median household income for district overall: $53,994. 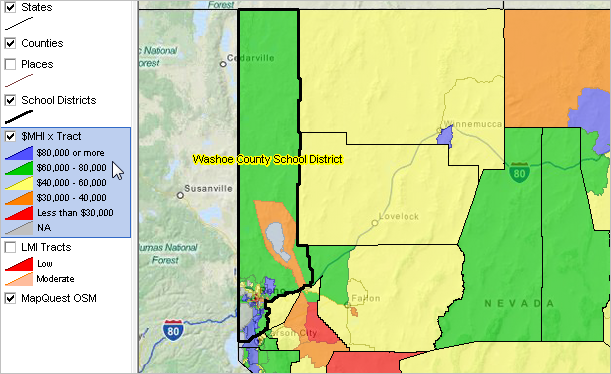 School district bold black boundary; click graphic for larger view View developed using CV XE GIS and Nevada DMI GIS Project. See related Reno community profile. See related Washoe county projections to 2020. Wichita Public Schools, KS gotop 2013-14 school year enrollment: 51,169 Map shows patterns of economic prosperity by neighborhood. .. ACS 2012 5-year median household income for district overall: $43,171. 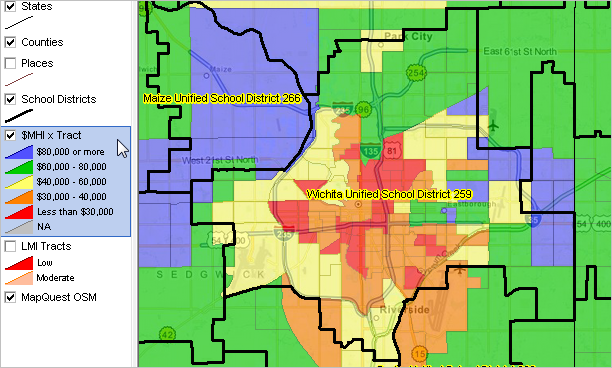 School district bold black boundary; click graphic for larger view View developed using CV XE GIS and Kansas DMI GIS Project. Click this link to view detailed 5-part demographic-economic characteristics for this school district. See related Wichita community profile. See related Sedgwick county projections to 2020. Additional Information ProximityOne develops geographic-demographic-economic data and analytical tools and helps organizations knit together and use diverse data in a decision-making and analytical framework. We develop custom demographic/economic estimates and projections, develop geographic and geocoded address files, and assist with impact and geospatial analyses. Wide-ranging organizations use our tools (software, data, methodologies) to analyze their own data integrated with other data. Follow ProximityOne on Twitter at www.twitter.com/proximityone. Contact ProximityOne (888-364-7656) with questions about data covered in this section or to discuss custom estimates, projections or analyses for your areas of interest. |
|
|