|
|
|
Maricopa County/Phoenix Area, AZ Map Project This section provides information on how to download and use the Maricopa County, AZ mapping application project. How to Acquire the Map File Projects Online. You can download the map file projects or acquire them on CD-ROM. The Maricopa, AZ map file project as a zip file is 22MB and expands to 70MB. Contact Proximity for access information. Files in the Map Project. The files used in the map project reviewed here are for Maricopa County, Arizona (Phoenix, AZ area). Maricopa County is represented as FIPS (Federal Information Processing Standards) code 013 in Arizona which is FIPS state code 04. The shorthand geocode notation for Maricopa County, AZ is 04013. This shorthand coding enables us to use the same set of state and county codes to refer to San Francisco County (075) in California (06) as 06075. The files on the distribution CD-ROM or in the zip file are "shapefile sets" and project files. For convenience of reference, it is assumed that users download the zip file and expand it into a folder named c:\azdemo. The shapefiles referenced in the project file as distributed (all references are for Census 2000 except as noted) are: • m04013e.* -- elementary school districts (from m04013d.zip) • m04013s.* -- secondary school districts (from m04013d.zip) • m04013u.* -- unified school districts (from m04013d.zip) • m04013c.* -- county perimeter (from m04c.zip) • m04013b.* -- census blocks (from m04013b.zip) • m04013g.* -- census block groups (from m04013g.zip) • m04013t.* -- census tracts (from m04013t.zip) • m04013r.* -- streets (from m04013r.zip) where * refers to the [typically] three files comprising the shapefile set: .shx, .shp, and .dbf. The following files have been added to the project from other sources: • d04013.* -- school districts (point file) • s04013a.* -- schools (point file) • majroads.* -- CFCC A11 street segments -- subset of m04013r.* • m04013a.* -- american indian reservation areas • m04013l.* -- landmark polygon areas • m04013pt.* -- landmark points • m04013p.* -- places (cities) Software Options. The map file projects have been set up for use with either the ESRI freeware ArcExplorer (this insures it will cost you nothing to view the mapping applications) and the ESRI feeware ArcView software. Other software options will be described in subsequent versions of this web page. Proximity has built two "project files" that are contained in the zip file. Project files are used by the software to organize access to the set of files used in the mapping application. One project file is for use with ArcExplorer and the other project file is for use with ArcView: C04013.AEP -- this project is for use with the freeware ESRI ArcExplorer C04013.APR -- this project is for use with the feeware ESRI ArcView software Which software to use? If you have the ArcView software, it is unlikely that you would want to use the ArcExplorer project. If you do not have the ArcView software, you can download the ArcExplorer freeware and immediately make use of the c04013.aep project and related files. This section is not a training session on the use of either of these software resources. Refer to separate document or instruction to learn the details of using the software. Download ArcExplorer and install. Starting the Application (Project). With the software installed, and the files existing in the c:\azdemo folder, you are ready to start. ArcExplorer. Assume that you are using ArcExplorer. Start ArcExplorer as a regular Windows operation. Use File|Open|Project and open the project named C04013.AEP. the screen will then appears as follows: 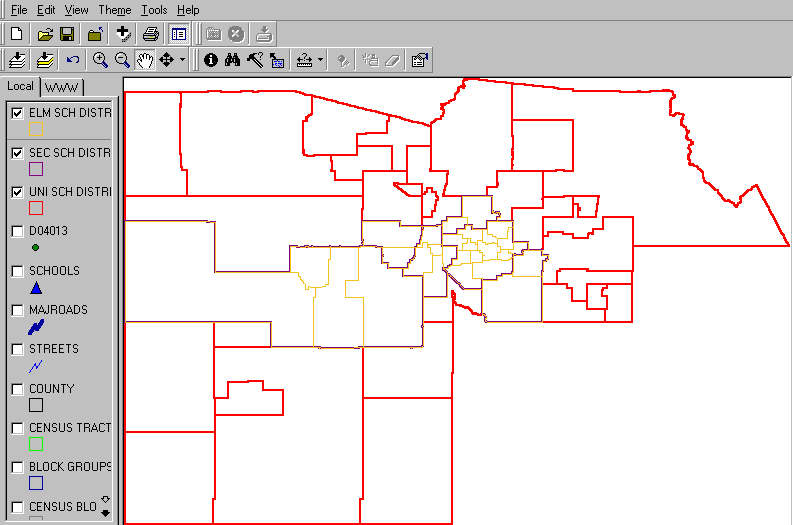 This screen shows three "layers" (map files) "turned on" -- Maricopa County unified school districts (red), secondary school districts (purple), and elementary school districts (gold). The other layers, shown in the legend box at the left, are not "turned on." More information is presented on orienteering under the ArcView discussion. This paragraph is the extent of the discussion in the present version of this web page regarding the use of ArcExplorer. We have set up the projects so that the themes appear almost identical between ArcExplorer and ArcView. So, following the description of ArcView applications should suffice for ArcExplorer also -- with one important exception. There are many applications that are not supported by ArcExplorer. ArcView. Assume that you are using ArcView. Start ArcView as a regular Windows operation. Use File|Open|Project and open the project named C04013.APR. the screen will then appears as follows: 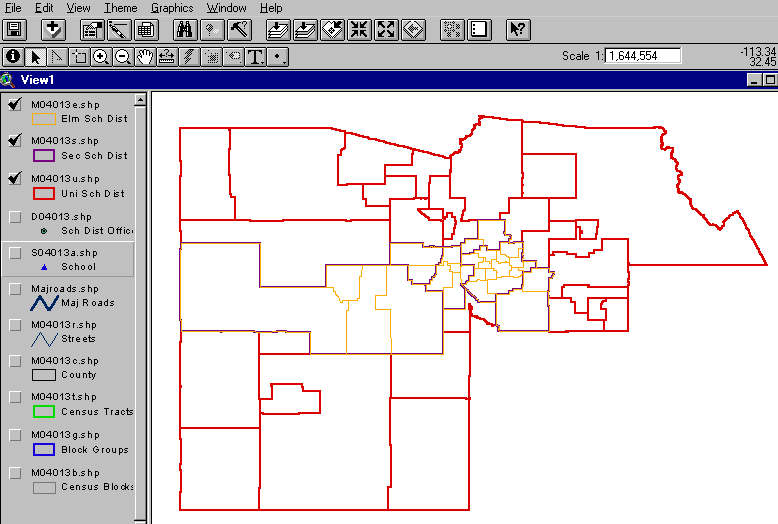 This screen above shows the almost identical set of displays as shown using ArcExplorer (previous screen display). Jumping In .... The next display shows a great deal of detailed information. We go from the most general display to this display so as to show what can be done. Next we will review some of the mechanical steps. 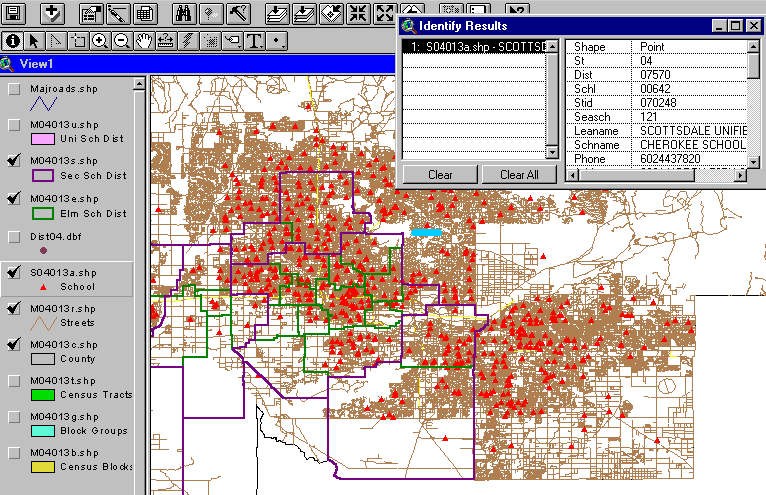 This [zoom-in] screen shows a zoom-in toward the center of the County. The all roads feature(layer) has been turned on. Secondary and elementary school district boundaries are shown. The locations of all schools are shown as icons. A query was performed to locate on school. A simple profile of this school (Cherokee in Scottsdale Unified) is shown in a display tables. This school is the icon located above the turquoise marker. Query to locate Peoria USD. With the default settings (the way the project file was originally structured), the query feature will be used to locate a specific school district. Click once on the
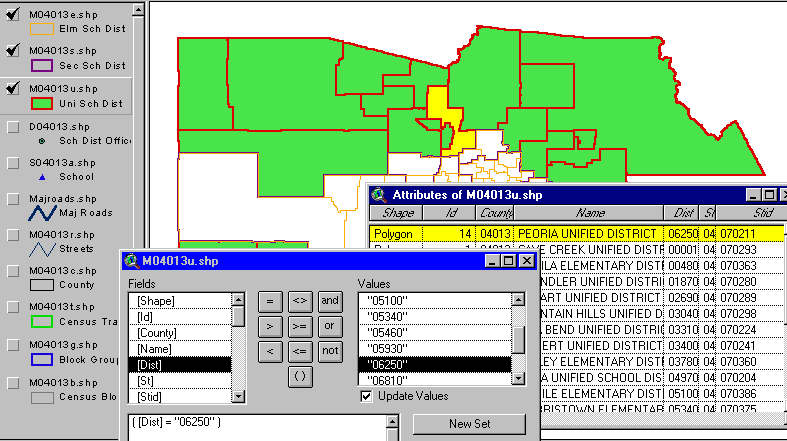
Zoom in to Peoria USD. As the starting point, we use the full screen display as shown in the previous application. Set your mouse operation to the zoom-in option. Now place the mouse at the upper left corner of the Peoria USD, click right, drag the mouse to a point to the lower right of Peoria USD, and release the mouse butotn. The following type of zoom display should appear on your screen. We had altered the green color which is not necessary to continue with the application. The name is shown in the display below but not your map. To display the name, choose Theme from the main menu bar and then Auto-Label. Take all defaults and the map redisplays with the name. Remove the name using the similar procedure but use "remove labels." 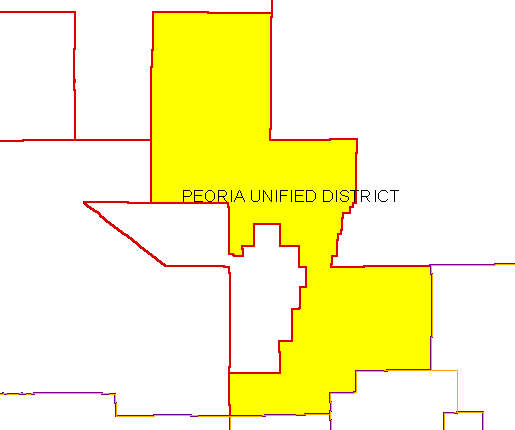
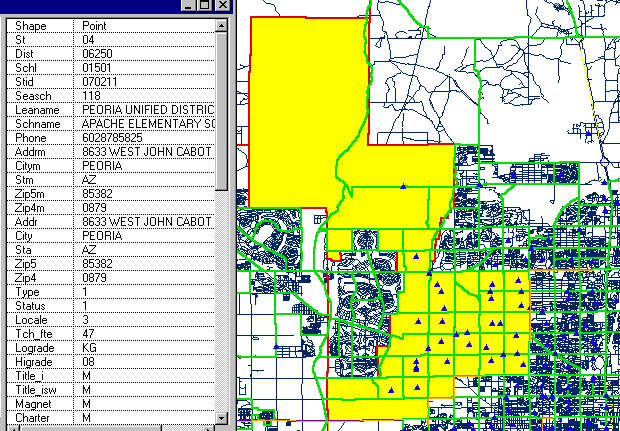
Attributes of Apache Elementary School in Peoria USD. As the starting point, we use the settings required to achieve the previous display. We seek examine attributes of a specific school in Peoria USD. This application could make use of any school in the county. After going through this process, choose a district and school of interest to you.
More screen displays and narrative will be added. These resources should be very valuable to mapping users who are already familiar with ArcView. If you have questions or comments about these applications/resources, contact Proximity. [goto top] |
|
|