|
|
|
School District Demographics See related paper: New York School Districts and K-12 Education: Analysis of Geodemographic Patterns and Characteristics 
|
Geospatial Analysis of Schools Needing Improvement
Proximity has developed tools that enable geospatial analysis of these schools in the context of all schools and K-12 education in any given state or area. The process involves using the NCLB school designations to add new data to an augmented version of the U.S. Department of Education Common Core of Data school level data file. Procedures used to develop these resources, and examples of the ways they can be used, are summarized below. Power and Importance. Why are the geospatial analysis resources important? How and who can benefit from them? Only using geospatial analysis tools, maps and mapping software, can analysts see the relative picture of where schools needing improvement are located with respect to other schools and the locale. This is important information for many stakeholders for many reasons. It is easier to see school choice alternatives. Patterns are more clearly identifiable than with lists and tables. It is easy to see change as improvement takes place (or does not) over time for the mix of all schools in an area of interest. Other types of data and geographically-oriented attributes can be viewed in context with schools (community centers, other resources). Focus on New York State. New York State schools which have been identified as schools in need of improvement under guidelines of the No Child Left Behind Act are listed here: Schools in Need of Improvement. Related performance data are reported here: NYSED Information and Reporting Services.
Step 1. The New York State Common Core of Data (CCD) file (previously converted into database structure) was processed to add latitude-longitude where there were missing values in the version distributed by NCES. The Proximity streets shapefiles and related geocoding resources are used in this process as well as other methods and tools. By having the latitude-longitude, we are now able to display each school as an icon on a map. Step 2. Using the list of schools needing improvement, the augmented (step 1) CCD file was further augmented by adding a field for NCLB designation and coded as follows: school improvement year 1 (1), school improvement year 2 (2), correction action (c), and school under registration review (s). Having the additional field we can now display schools as icons on a map and distinguish them by type of NCLB category. Many other types of analysis are also enabled. The following maps were prepared to show initial steps in geospatial analysis. Icons represent individual schools. Counties, comprising the NYC school district, are shown with red boundaries. Public Schools (green, 1228 schools) shown in context of counties (blue) comprising New York City 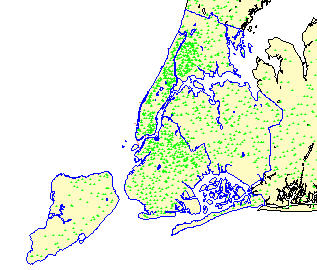
Map as above with community school district overlay 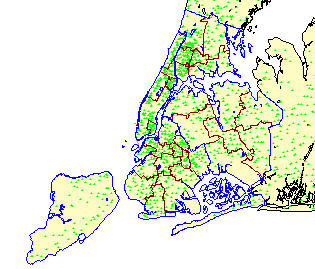
Map as above with school districts removed, showing 5-digit ZIP code areas 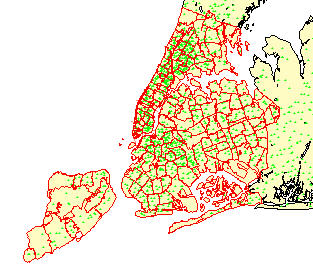
Schools needing improvement (yellow) and all other schools (blue) 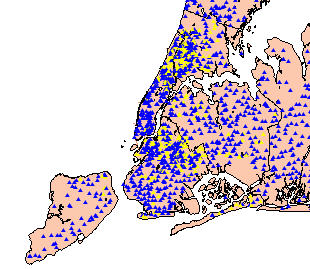
Map as above, zoom into Manhattan, showing community school districts 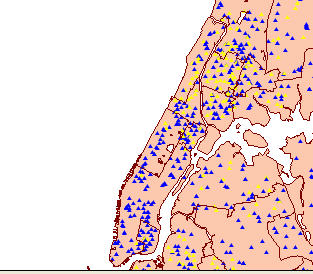
Map as above, further zoom into more focused study area 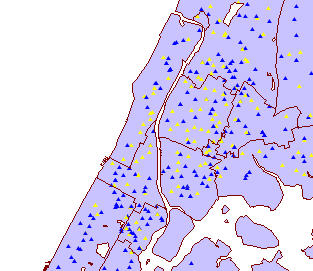
Map as above, further zoom to Community School District (CSD) 4 The following map shows schools in CSD 4 (located in bottom center of above map) categorized as 'in need of improvement' under NCLB as yellow icons, other schools as blue icons. 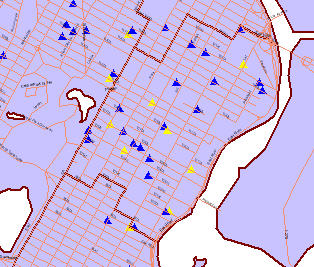
Map as above, further zoom with Community School District (CSD) 4 -- showing streets with labels -- showing school names. The following map shows schools in CSD 4 categorized as 'in need of improvement' under NCLB as yellow icons, other schools as blue icons. In the table following the map a comparison in made of school PS 72 (yellow by cursor) with school PS 38 (blue, red circle). 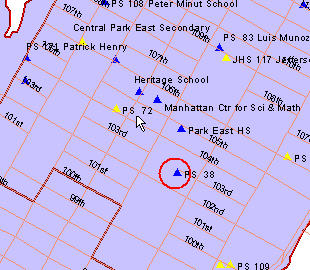
Profiles of the two schools highlighted in the map above are shown below. A stakeholder might be interested in comparing alternative schools within the same district -- those categorized as "in need of improvement" with other schools. It is apparent from the school profiles that the overall student composition is quite similar based on measures provided here.
[goto top] |
|
|
