|
|
|
School District Demographic Trends How are "school district community" demographics changing in school districts of interest to you? How do changes compare among a set of related peer districts over the past few years? What do these trends suggest about the size and demographic make-up for districts of interest in the years ahead? Read on to learn about the latest data and tools that can be used to help answer these questions. New official estimates of selected school district demographic characteristics are now available for all U.S. school districts. These data have been developed to meet the needs of the U.S. Department of Education for use in distributing Title I basic and concentration grants directly to school districts. The distributions require the most recent estimates of children in poverty available pursuant to the No Child Left Behind Act of 2001 (NCLB) Act. The data have a much wider set of uses for diverse planning and analyses conducted by school districts, stakeholders, researchers, and others. Texas School District Population Change 2000-2005 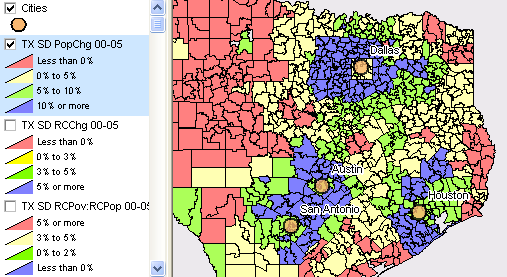
The above view shows patterns of total population change for part of Texas. See larger view (then press F11 key). Two other layers show relevant children population change by district 2000 to 2005 (view map -- then press F11 key) and the change in the percent relevant children in poverty from 2000 to 2005 (view map -- then press F11 key). This CommunityViewer project was developed using the SDDTRENDS database. Similar pattern views may be prepared for any state or region. Time Frame and Geography. The new estimates provide an annual time series for 2000 through 2005. Updated annually, these data enable a time series comparative analysis among school districts within and among states using a standardized methodology. Note that the 2005 estimates are for school district boundaries defined as of the 2004-05 school year. Data may not be comparable over time for districts which have had boundary changes since 2000. Subject Matter. Subject matter items include total population, [grade] relevant population ages 5 through 17, and [grade] relevant population in families in poverty. The relevant population estimates pertain to all resident school-age children ages 5-17, inclusive, whether enrolled in public or private school, or not enrolled. See additional notes on relevancy and grade ranges. Comparable Data. While all school districts provide administratively reported enrollment data, the administrative data do not provide data on the size of the total population, size of the relevant population ages 5-17 (only those enrolled in public school), nor size of the relevant population ages 5-17 in poverty. Software for Analysis & Interpretation. Proximity comparative analysis software enables the user to prepare a time series comparative analysis profile. The following example shows the largest four school districts in the U.S. As many districts as desired may be multi-selected from the listbox. The listbox displays all school districts in sort order by state and by district name. The data grid in the following graphic provides a mini-profile for each school district. 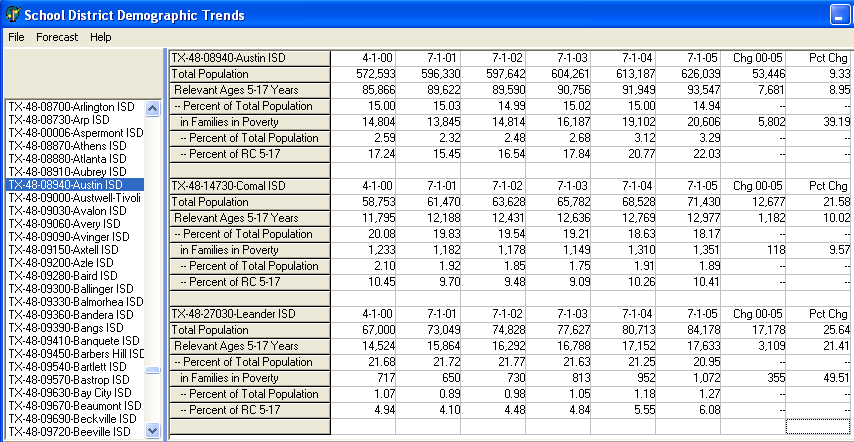
As the profiles are written to the grid, an Excel file is also created: 
Accessing & Using the Trend Data. School district demographic trend data are available as follows: • Excel files for one or a selected set of districts. • SDDTrends software and database for use on your PC: - SDDTrends software bundled with all school districts in a state. - SDDTrends software bundled with all school districts in the U.S. Register for more information. Terms and Definitions Grade Ranges of Responsibility and Relevant Children. The school district grade range establishes the definition of relevant children for that district. The district grade range is that set of grades for which the district is financially responsible to provide. The specified grades are either provided from schools that operate within the district, or by purchasing instruction from neighboring districts. In most states, all districts provide K-12 education; however, some states have separate elementary and secondary school districts, each exclusively responsible for providing education in some grades in their shared territory. Relevant Children. Each child is considered relevant to one and only one district. If a district provides all K-12 grades throughout their territory, all children within the territory are relevant to that district. If an elementary and secondary district occupy the same territory, the child is relevant to the district that provides the grade for that child's age. Specific Data Item Descriptions. Estimates are provided for these items: • relevant children ages 5-17, inclusive • relevant children who are related to the householder and reside in families whose [previous year] income falls below the poverty threshold appropriate to that family • total population of all ages residing in the spatial boundaries of the district. Note that because of overlapping districts, the sum of the total populations of the districts will exceed the total population of the nation. Related children are people age 5-17 related by blood, marriage, or adoption to the householder of the housing unit in which they reside. The householder and the spouse of the householder, foster children, other unrelated individuals, and residents of group quarters are not related children. [goto top] |
|
|