|
|
|
School District DMI Main Page Fiscal Year 2010 Allocations |
Elementary and Secondary Education Act/ESEA Title I Analysis
The Federal government hopes these ARRA funds will create improved educational opportunities for at-risk students and close the achievement gaps while also stimulating the economy. Among goals are to enable LEAs to help more at-risk students and boost the quality of teaching and learning. Assessing Scope, Use, and Results Will these ARRA expenditures help? Based on these data shown in the ranking table below, there are 13,753 LEAs with an average population ages 5-to-17 (P517) of 3,866 and an average P517 in poverty of 618 (15.98%). • The weighted average ARRA expenditure per P517 is $176. • The weighted average ARRA expenditure per P517 in poverty is $1,104. • The average LEA receives approximately $682,000. How do these measures relate to your districts of interest? See the table below. How should these funds be expended to improve the primary goals (educational opportunities for at-risk students and close the achievement gaps)? In the past these funds have mainly been used for instruction-based intervention and augmentation (more/different teachers/aides, longer sessions, augmented teaching tools and processes, varied class structures/operations). See one results analysis here. The primary issue, however, is lacking interest, motivation, propensity/ability to participate in learning by the students. Analyzing where Title I objective students are located (residences) and developing neighborhood-based outreach programs to stimulate involvement may be a far better use of these funds. Title I provisions specifically enable use of the funds for "Using longitudinal data systems to drive continuous improvement efforts focused on improving achievement in Title I schools." See Examples of potential uses of the Title I (find that text on the target page). School District ARRA 2009 Title I Funding and Related Demographics Interactive ranking table -- click column header to sort; click again to sort other direction. See related Ranking Tables Main Page Column Descriptions Tot Pop -- total population for the district, 2007 1/ Pop5-17 -- population ages 5-17 years, 2007 1/ Pop5-17Pov -- population ages 5-17 years in poverty, 2007 1/ %Pop5-17Pov -- Percent population ages 5-17 years in poverty (% of Tot Pop) 1/ Tot ARRA$ -- Total Spring 2009 ARRA$ distribution to this district AARA$/P517 -- Tot ARRA$ per population ages 5-17 years AARA$/P517Pov -- Tot ARRA$ per population ages 5-17 years in poverty see additional notes 1/ as estimated by Census Bureau for Title I, released 12/08 CommunityViewer GIS Geodemographic Analysis Acquire CommunityViewer GIS software and ARRA datasets; focus analysis on districts/regions of interest to you; integrate your data. Patterns of ARRA$ Distribution by School District (ARRA$ per population ages 5-17) 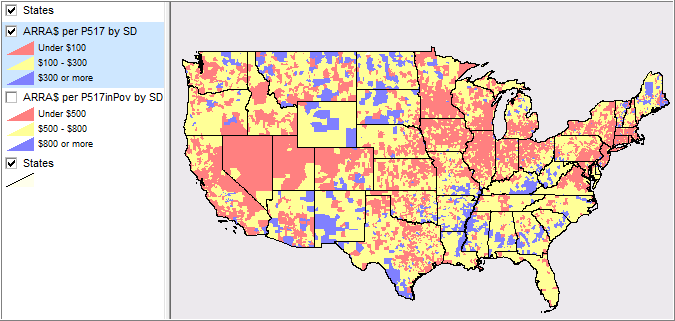
Patterns of ARRA$ Distribution by School District (ARRA$ per population ages 5-17 in Poverty) 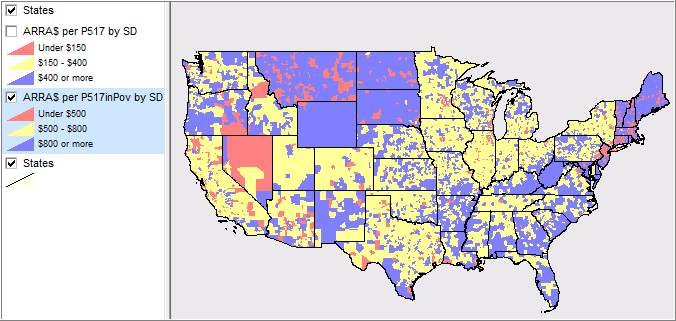
Patterns of ARRA$ Distribution by School District (ARRA$ per population ages 5-17 in Poverty) Zoom-in view with county layer 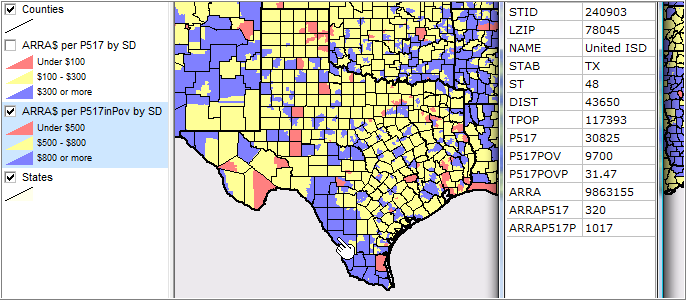
Additional Notes Actual ARRA amounts received by school districts will be smaller than shown here due to State-level adjustments to Federal Title I allocations. The ARRA data reflect preliminary estimates based on currently available data. Allocations may be revised based on possible new data. Additional Information Proximity develops geodemographic data and analytical tools and methods relating to children, schools, school districts, and educational institutions and helps organizations knit together and use diverse data in a decision-making and analytical framework. We develop custom demographic/economic estimates and projections, develop geographic and geocoded address files, and assist with impact and geospatial analyses. Wide-ranging organizations use our tools (software, data, methodologies) to analyze their own data integrated with other data. Contact Proximity (888-364-7656) with questions about data covered in this section or to discuss custom estimates, projections or analyses for your areas of interest. |
|
|