|
|
|
ZIP Code Geographic-Demographic-Economic Resources
This section provides information on selected ZIP Code geographic-demographic-economic resources, analytical tools and related services available from ProximityOne. Guide to ZIP Code Area Geographic-Demographic-Economic Data Resources -- http://proximityone.com/zipdata_resources.htm 11.19.15. Relating Block Groups to ZIP Code Areas ... interactive table & GIS tools/applications ... population and area for each BG part intersecting with ZIP code area ... See http://proximityone.com/bg-zip.htm San Francisco Block Group 06-075-015700-1 in Context of ZIP 94115 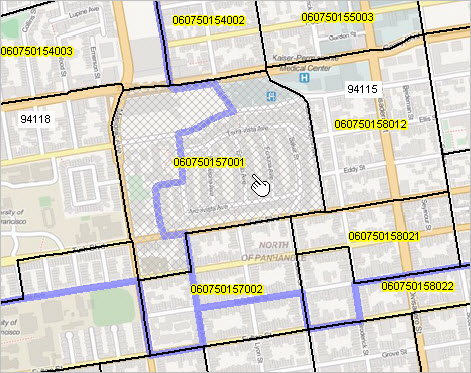 10.20.15. Mapping ZIP Code Demographics ... tools and data resources for analyzing ZIP Code area patterns ... interactive table & GIS applications ... http://proximityone.com/mapping_zipcode_demographics.htm Los Angeles area; patterns of economic prosperity by ZIP code 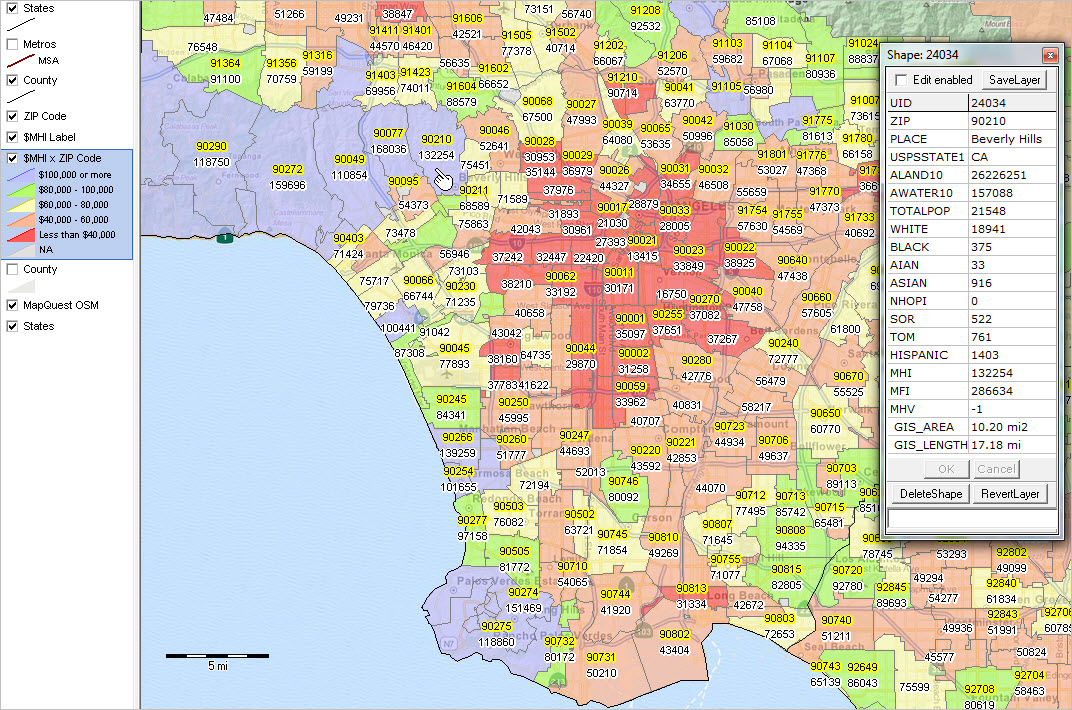 Dallas, TX Metro Area Rental Vacancy Rate by ZIP Code 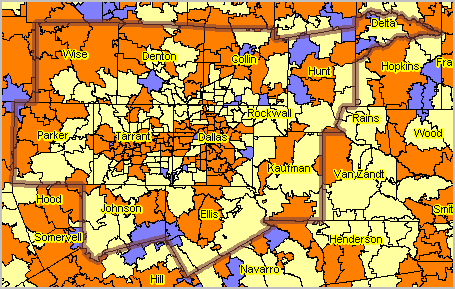 See larger view with details See map views illustrating use of Census 2010 & Census 2000 ZIP Code Area geography: -- http://proximityone.com/gallery/guide/index.htm?census2010zcta.htm ZIP Code Demographic-Economic Datasets Updated December 2014 ... the U.S. national scope ZIP Code demographic-economic data include approximately 600 subject matter items organized into four groups. These datasets are available as ACS 2011 5-year estimates. ACS 2012 5-year estimates. ACS 2013 5-year estimates and ProximityOne annual estimates and projections to 2019. (updated/extended annually). Use the scroll boxes shown below to view/browse subject matter items included.
AGE AND GENDER
Total population Male Female Under 5 years 5 to 9 years 10 to 14 years 15 to 19 years 20 to 24 years 25 to 34 years 35 to 44 years 45 to 54 years 55 to 59 years 60 to 64 years 65 to 74 years 75 to 84 years 85 years and over Median age (years) 18 years and over 21 years and over 62 years and over 65 years and over 18 years and over Male Female 65 years and over Male Female RACE Total population One race Two or more races One race White Black or African American American Indian and Alaska Native Cherokee tribal grouping Chippewa tribal grouping Navajo tribal grouping Sioux tribal grouping Asian Asian Indian Chinese Filipino Japanese Korean Vietnamese Other Asian Native Hawaiian and Other Pacific Islander Native Hawaiian Guamanian or Chamorro Samoan Other Pacific Islander Some other race Two or more races White and Black or African American White and American Indian and Alaska Native White and Asian Black or African American and American Indian and Alaska Native Race alone or in combination with one or more other races Total population White Black or African American American Indian and Alaska Native Asian Native Hawaiian and Other Pacific Islander Some other race HISPANIC OR LATINO AND RACE Total population Hispanic or Latino (of any race) Mexican Puerto Rican Cuban Other Hispanic or Latino Not Hispanic or Latino White alone Black or African American alone American Indian and Alaska Native alone Asian alone Native Hawaiian and Other Pacific Islander alone Some other race alone Two or more races Two races including Some other race Two races excluding Some other race, and Three or more races Total housing units
EMPLOYMENT STATUS
Population 16 years and over In labor force Civilian labor force Employed Unemployed Armed Forces Not in labor force Civilian labor force Percent Unemployed Females 16 years and over In labor force Civilian labor force Employed Own children under 6 years All parents in family in labor force Own children 6 to 17 years All parents in family in labor force COMMUTING TO WORK Workers 16 years and over Car, truck, or van -- drove alone Car, truck, or van -- carpooled Public transportation (excluding taxicab) Walked Other means Worked at home Mean travel time to work (minutes) OCCUPATION Civilian employed population 16 years and over Management, business, science, and arts occupations Service occupations Sales and office occupations Natural resources, construction, and maintenance occupations Production, transportation, and material moving occupations INDUSTRY Civilian employed population 16 years and over Agriculture, forestry, fishing and hunting, and mining Construction Manufacturing Wholesale trade Retail trade Transportation and warehousing, and utilities Information Finance and insurance, and real estate and rental and leasing Professional, scientific, and management, and administrative and waste management services Educational services, and health care and social assistance Arts, entertainment, and recreation, and accommodation and food services Other services, except public administration Public administration CLASS OF WORKER Civilian employed population 16 years and over Private wage and salary workers Government workers Self-employed in own not incorporated business workers Unpaid family workers INCOME AND BENEFITS (IN 2010 INFLATION-ADJUSTED DOLLARS) Total households Less than $10,000 $10,000 to $14,999 $15,000 to $24,999 $25,000 to $34,999 $35,000 to $49,999 $50,000 to $74,999 $75,000 to $99,999 $100,000 to $149,999 $150,000 to $199,999 $200,000 or more Median household income (dollars) Mean household income (dollars) With earnings Mean earnings (dollars) With Social Security Mean Social Security income (dollars) With retirement income Mean retirement income (dollars) With Supplemental Security Income Mean Supplemental Security Income (dollars) With cash public assistance income Mean cash public assistance income (dollars) With Food Stamp/SNAP benefits in the past 12 months Families Less than $10,000 $10,000 to $14,999 $15,000 to $24,999 $25,000 to $34,999 $35,000 to $49,999 $50,000 to $74,999 $75,000 to $99,999 $100,000 to $149,999 $150,000 to $199,999 $200,000 or more Median family income (dollars) Mean family income (dollars) Per capita income (dollars) Nonfamily households Median nonfamily income (dollars) Mean nonfamily income (dollars) Median earnings for workers (dollars) Median earnings for male full-time, year-round workers (dollars) Median earnings for female full-time, year-round workers (dollars) PERCENTAGE OF FAMILIES AND PEOPLE WHOSE INCOME IN THE PAST 12 MONTHS IS BELOW THE POVERTY LEVEL All families With related children under 18 years With related children under 5 years only Married couple families With related children under 18 years With related children under 5 years only Families with female householder, no husband present With related children under 18 years With related children under 5 years only All people Under 18 years Related children under 18 years Related children under 5 years Related children 5 to 17 years 18 years and over 18 to 64 years 65 years and over People in families Unrelated individuals 15 years and over These data are estimates centric to mid-2009 based on the American Community Survey. ZIP Code Areas (ZCA) are comprised of Census 2010 census blocks. These data are structured as 4 CSV files, each with one record per ZIP Code Area and contain the ZIP code followed by items listed in above scroll boxes. The CSV files may be used directly with ProximityOne S&O Desktop as well as Excel 2007 and later. View/rank/query/compare ZCA demographic-economic data using interactive ranking tables. ACS 2011 Estimates: • General Demographics • Social Characteristics • Economic Characteristics • Housing Characteristics ACS 2012 Estimates: • General Demographics • Social Characteristics • Economic Characteristics • Housing Characteristics The U.S. national scope ACS 2011 datasets, ACS 2012 datasets and ProximityOne annual projections to 2018 datasets are available on a fee basis. Contact us for more information (mention ZIP Code area estimates and projections). Census 2010 ZIP Code Demographic Profile Dataset The ZIPDP2010 is a national scope Census 2010 ZIP Code Tabulation Area Demographic Profile dataset developed by ProximityOne that is structured as a dBase (dbf4) file. Each record in the ZIPDP2010 dataset contains the identification fields and subject matter fields described at http://proximityone.com/cen2010_zcta_dp.htm. Contact us for more information (mention ZIPDP2010 DP Dataset in text section). See map views illustrating use of Census 2010 & Census 2000 ZCTA geography: -- http://proximityone.com/gallery/guide/index.htm?census2010zcta.htm Census 2010 ZIP Code Shapefile with Integrated Demographic Profile Data The ZIPDP2010 shapefile is a national scope Census 2010 ZIP Code Tabulation Area shapefile with integrated Demographic Profile data. Each record in the ZIPDP2010 dataset contains the identification fields and subject matter fields described at http://proximityone.com/cen2010_zcta_dp.htm. Contact us for more information (mention ZIPDP2010 Shapefile w/Integrated DP Data in text section). ZIP Code Demographics by City-Place Use the ranking table at http://proximityone.com/zip-place.htm to view a city/place by ZIP code and selected associated demographics for each ZIP code portion in that city/place. Examine how split ZIP codes are split by specific place and non-place areas. Data are available as a national scope dataset. Census 2010 ZIP Code Tabulation Areas (ZCTAs) and Places geographies are both comprised of sets of census blocks. Census block level data from the Census 2010 Summary File 1 (SF1) have been aggregated into ZIP code-Place parts to develop these data. Contact us for more information (mention ZIP Code Demographics by City-Place in text section). ZIP Code Demographics by Congressional District Use the ranking table at http://proximityone.com/zip-cd.htm to view/analyze demographics for ZIP code sections intersecting with congressional districts. Examine how split ZIP codes are split by congressional districts of interest. Data are available as a national scope dataset. Census 2010 ZIP Code Tabulation Areas (ZCTAs) and Places geographies are both comprised of sets of census blocks. Census block level data from the Census 2010 Summary File 1 (SF1) have been aggregated into ZIP code-congressional district to develop these data. Contact us for more information (mention ZIP Code Demographics by Congressional District in text section). ZIP Code Demographics by School District Use the ranking table at http://proximityone.com/zip-sd.htm to view/analyze demographics for ZIP code sections intersecting with school districts. Examine how split ZIP codes are split by school districts of interest. Data are available as a national scope dataset. Census 2010 ZIP Code Tabulation Areas (ZCTAs) and Places geographies are both comprised of sets of census blocks. Census block level data from the Census 2010 Summary File 1 (SF1) have been aggregated into ZIP code-school district to develop these data. Contact us for more information (mention ZIP Code Demographics by School District in text section). Tools to Analyze ZIP Code Area Demographics: Population by Single Year of Age Variants Use Modeler II to analyze Census 2010 and projections of ZIP Code area population by single year of age by gender by race/ethnicity. • Compare one or more selected ZIP Codes areas and associated study area aggregates. • Choose from wide-ranging comparative analysis geography: census tract up. • Flexibly examine age groups of key interest. • Examine multicultural patterns. • Export your results of your analyses for publishing or further analysis. ... Start using M2 .. http://proximityone.com/m2/m2guide (click ZIP Code Applications in left panel). ZIP Code Business Patterns Use the interactive ZIP code business patterns table to examine the number of business establishments, employment and earnings by 5-digit ZIP code. ... start using ranking table. ZIP Code to County or Metro Equivalencing Use the interactive ZIP code equivalence table to determine the county and metropolitan area in which 5-digit ZIP codes of interest are located. ... start using ranking table. Other ZIP Code Data Resources ... Census 2000 5-Digit ZIP Demographic Profile Database The 5-Digit ZIP (ZIP Code Tabulation Area) Demographic Profile Database is comprised of 4 dbase structured files. This set of files contains the most widely used set of approximately 550 subject matter items derived from Census 2000 summary files. The database consists of four subject matter files containing data as organized and described in the following links. • DP-1 General Demographics • DP-2 Social Characteristics • DP-3 Economic Characteristics • DP-4 Housing Characteristics A sample display of the data may be accessed at http://proximityone.com/p1zip.htm. 5-Digit ZIP Code Basic Demographics File The national scope 5-Digit ZIP (ZIP Code Tabulation Area) Basic Demographics file record contains the following fields derived from Census 2000 Summary File 1: USPS State Abbreviation 5-digit ZIP Code tabulation area code Total Population (2000) N9 Total Housing Units (2000) N9 Land Area (square meters) N14 Water Area (square meters) N14 Land Area (square miles) N12.6 Water Area (square miles) N12.6 Latitude (decimal degrees) N9.6 Longitude (decimal degrees) N10.6 5-Digit ZIP Code Extended Demographics Dataset The 5-Digit ZIP Code (ZIP Code Tabulation Area) Code Extended Demographics Data File is a dBase structured file that contains the Census 2000 subject matter fields as described at http://proximityone.com/dp2000et.htm (DP-1 items). Data in the extended demographics file may be used to develop profiles such as this example for ZIP Code 77027 in Houston, TX (PDF). 5-Digit ZIP Code Age-Race-Sex Demographics Dataset The 5-Digit ZIP Code (ZIP Code Tabulation Area) Age-Race-Sex Demographics Dataset is a dBase structured file that contains the Census 2000 data for these categories: Male population Female population Population by age for these age ranges: 0-10 years 11-17 years 18-29 years 30-39 years 40-49 years 50-59 years 60-64 years 65-74 years 75 years and over for each of these race/ethnic categories: Not Hispanic White Black AIAN API Other 2+ Races Hispanic ZIP-Census Block Demographics and Equivalency File [goto top] The ZIP-Census Block Demographics and Equivalency File enables a user to determine the set of Census 2000 census blocks that comprise a ZIP Code (ZIP Code Tabulation Area) area. The ZIP-Census Block Demographics and Equivalency File contains a record for each unique combination of a ZIP code area and census block (8.2 million geographic areas) Each record provides geographic area measurements, latitude-longitude, and the same set of demographic data fields (DP-1 items for each census block) as contained in the Extended Demographics file. ZIP Code Equivalence Files The following 2010 ZIP Code (ZCTA) equivalence/relationship files are available. Contact us for details (888-364-7656). • ZIP to County • ZIP to County Subdivision • ZIP to Place • ZIP to Census Tract • ZIP to Congressional District • ZIP to Metropolitan and Micropolitan Statistical Areas Support Using these Resources Learn more about demographic economic data and related analytical tools. Join us in a Data Analytics Lab session. There is no fee for these Web sessions. Each informal session is focused on a specific topic. The open structure also provides for Q&A and discussion of application issues of interest to participants. ProximityOne User Group Join the ProximityOne User Group to keep up-to-date with new developments relating to geographic-demographic-economic decision-making information resources. Receive updates and access to tools and resources available only to members. Use this form to join the User Group. Additional Information ProximityOne develops geographic-demographic-economic data and analytical tools and helps organizations knit together and use diverse data in a decision-making and analytical framework. We develop custom demographic/economic estimates and projections, develop geographic and geocoded address files, and assist with impact and geospatial analyses. Wide-ranging organizations use our software, data and methodologies to analyze their own data integrated with other data. Follow ProximityOne on Twitter at www.twitter.com/proximityone. Contact ProximityOne (888-364-7656) with questions about data covered in this section or to discuss custom estimates, projections or analyses for your areas of interest. |
|
|